Copyright
©2012 Baishideng Publishing Group Co.
World J Gastroenterol. Dec 21, 2012; 18(47): 6943-6950
Published online Dec 21, 2012. doi: 10.3748/wjg.v18.i47.6943
Published online Dec 21, 2012. doi: 10.3748/wjg.v18.i47.6943
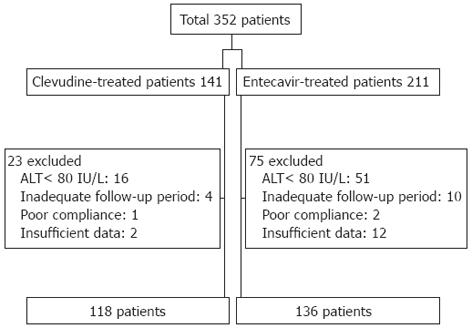
Figure 1 Flow chart of patient enrollment.
ALT: Alanine aminotransferase.
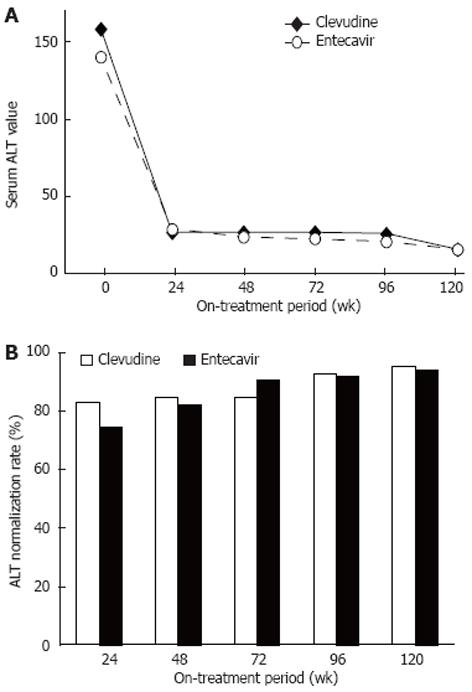
Figure 2 Median changes in serum alanine aminotransferase values and cumulative rates of alanine aminotransferase normalization during the on-treatment period.
A: Alanine aminotransferase (ALT) values; B: Cumulative rates of ALT normalization.
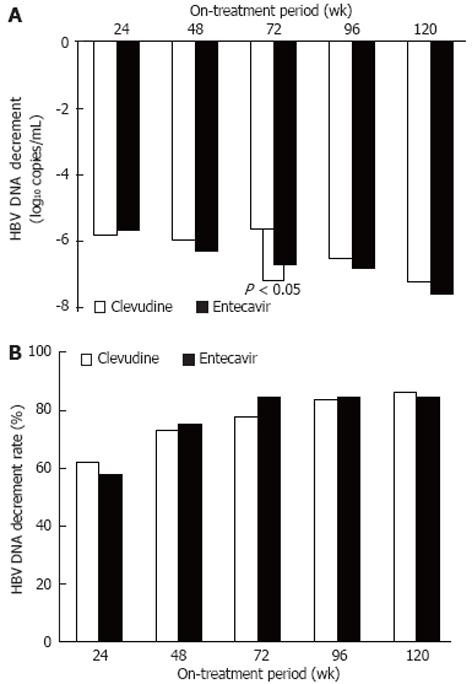
Figure 3 Decrement changes in serum hepatitis B virus DNA titer and cumulative rates of hepatitis B virus DNA non-detection during the on-treatment period.
A: Hepatitis B virus (HBV) DNA decrement changes; B: HBV DNA non-detection rate.
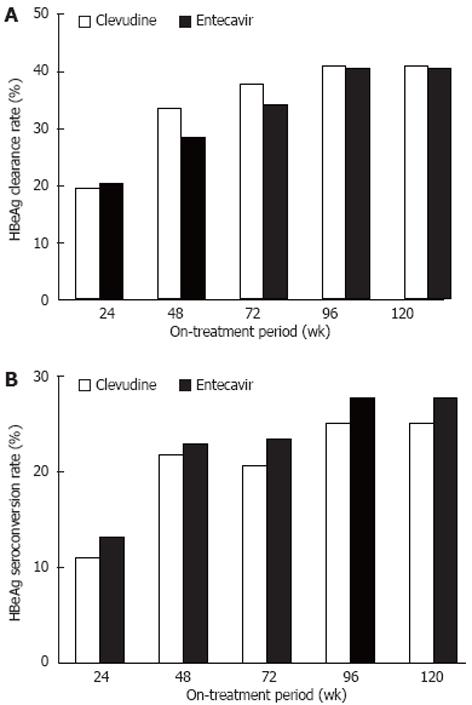
Figure 4 Cumulative rates of hepatitis B e antigen clearance and hepatitis B e antigen seroconversion during the on-treatment period.
A: Hepatitis B e antigen (HBeAg) clearance rate; B: HBeAg seroconversion rate.
- Citation: Kim SB, Song IH, Kim YM, Noh R, Kang HY, Lee HI, Yang HY, Kim AN, Chae HB, Lee SH, Kim HS, Lee TH, Kang YW, Lee ES, Kim SH, Lee BS, Lee HY. Long-term treatment outcomes of clevudine in antiviral-naive patients with chronic hepatitis B. World J Gastroenterol 2012; 18(47): 6943-6950
- URL: https://www.wjgnet.com/1007-9327/full/v18/i47/6943.htm
- DOI: https://dx.doi.org/10.3748/wjg.v18.i47.6943


