Copyright
©2012 Baishideng Publishing Group Co.
World J Gastroenterol. Jan 21, 2012; 18(3): 257-267
Published online Jan 21, 2012. doi: 10.3748/wjg.v18.i3.257
Published online Jan 21, 2012. doi: 10.3748/wjg.v18.i3.257
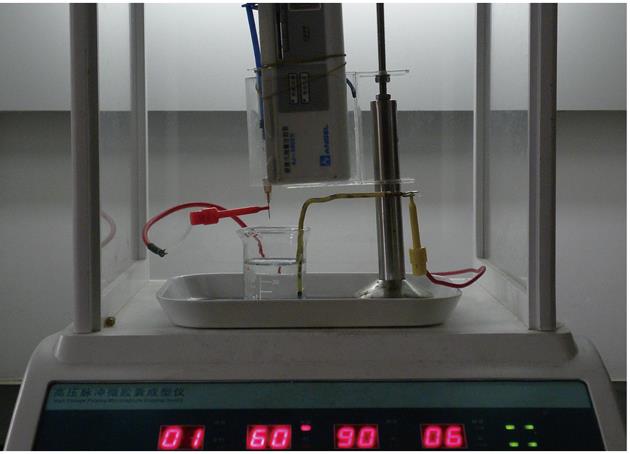
Figure 1 High frequency pulse microdroplet generator.
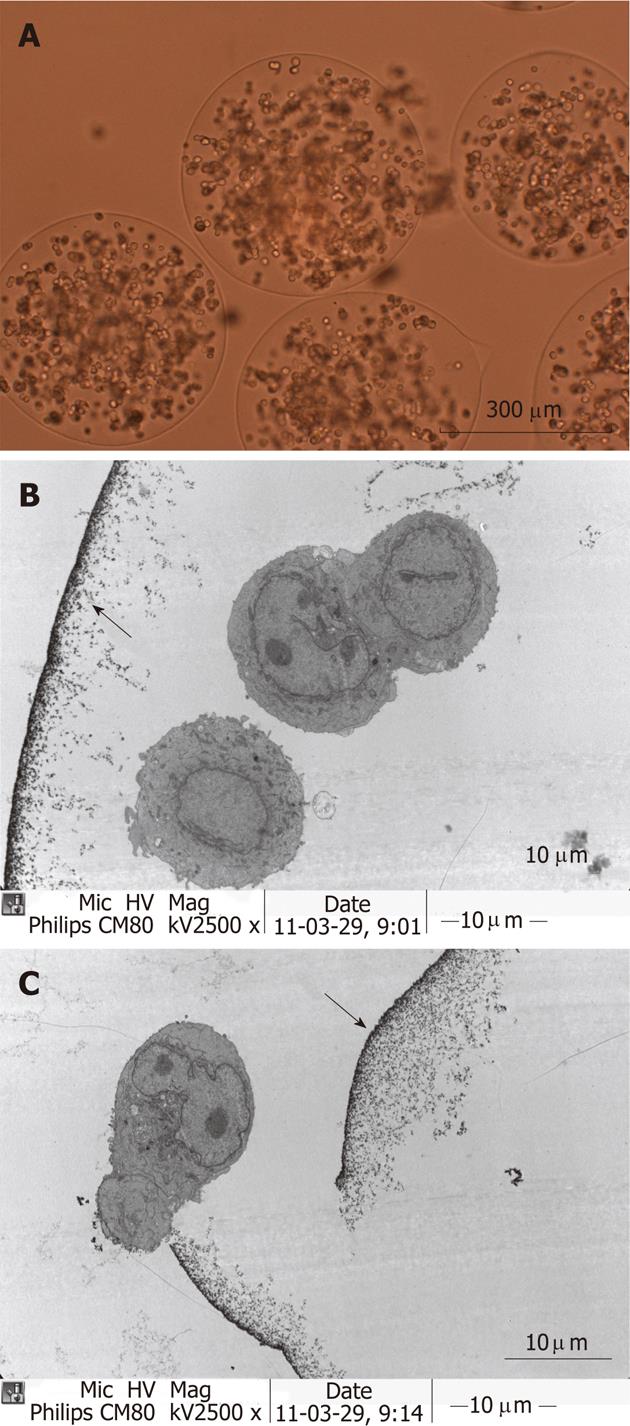
Figure 2 In vitro culture of cancer microcapsules after 5 to 7 d of in vitro incubation.
A: Cancer microcapsules were filled with proliferated cells forming spheroids (× 100); B: Transmission electron microscope observation of encapsulated tumor cells (× 2500); C: Transmission electron microscope observation of encapsulated tumor cells after membrane burst (× 2500). Arrows are pointing to membrane of the microcapsule in B and C.
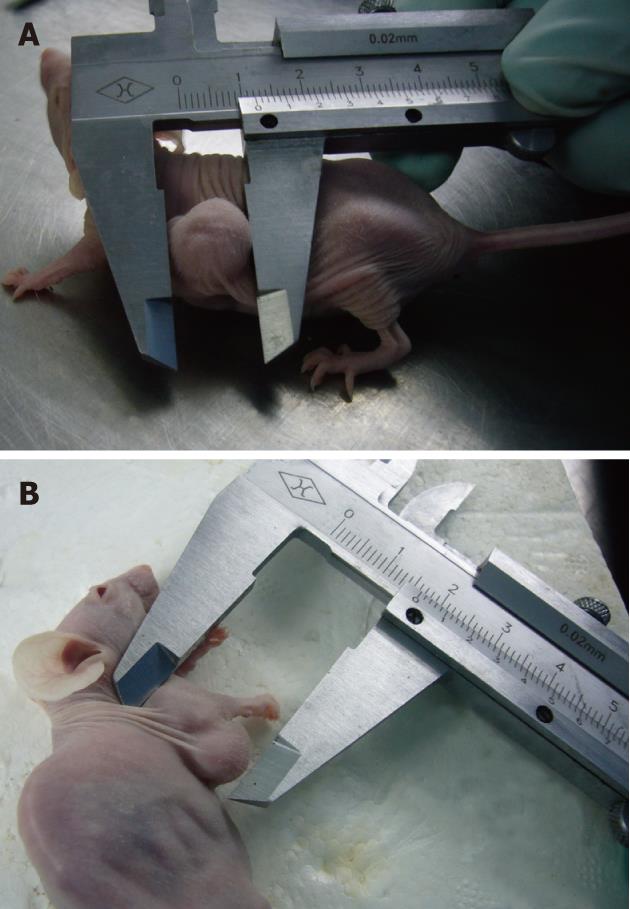
Figure 3 Progression of subcutaneous implantation tumor 8 wk after injection.
A: Cancer cell microencapsulation group; B: Single cell suspensions group.
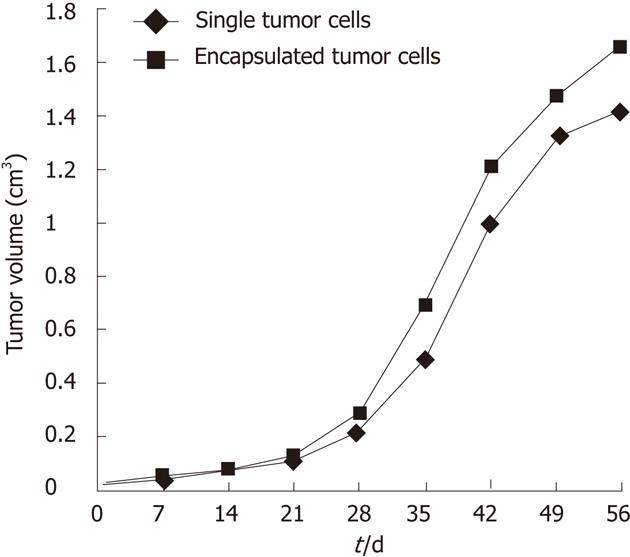
Figure 4 Growth curve of subcutaneous implantation tumor volume.
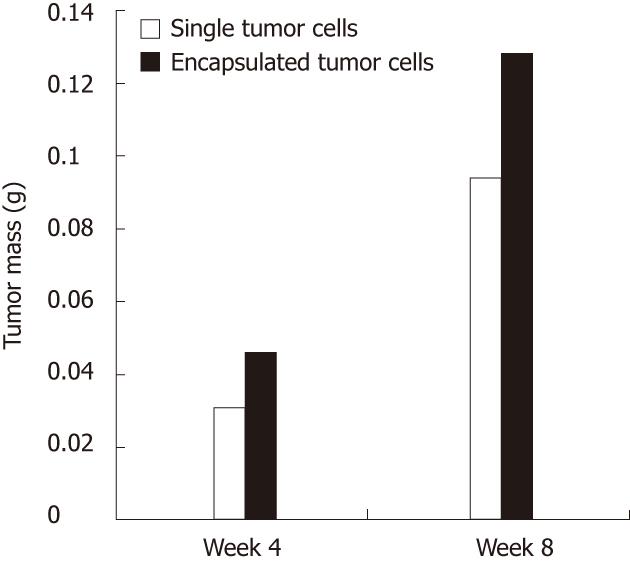
Figure 5 Tumor weights at different stages.
Group of microencapsulation had statistically larger tumors at 8th wk compared with single tumor cells group yet no statistical differences at 4th wk.
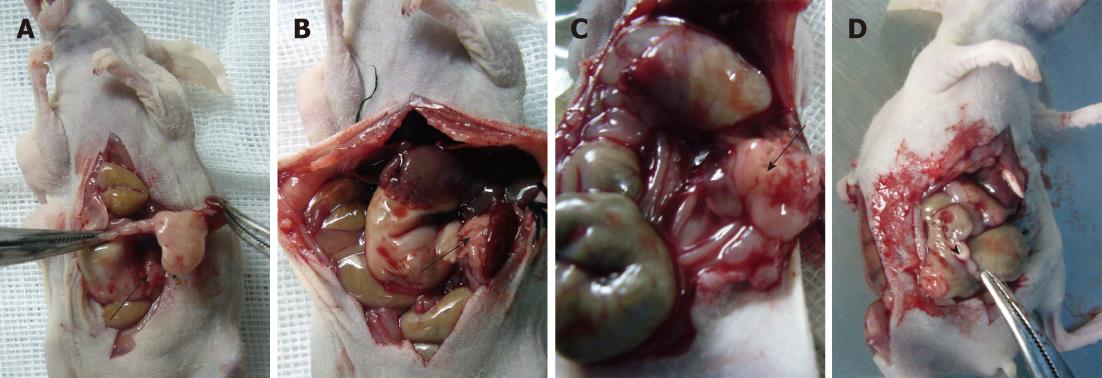
Figure 6 Orthotopic implantation tumor production.
A: Single tumor cells at 4th wk post-implantation; B-D: Microencapsulated tumor cells at 8th wk post-implantation. Arrows: Primary tumor; Arrow head: Metastasis lesion.
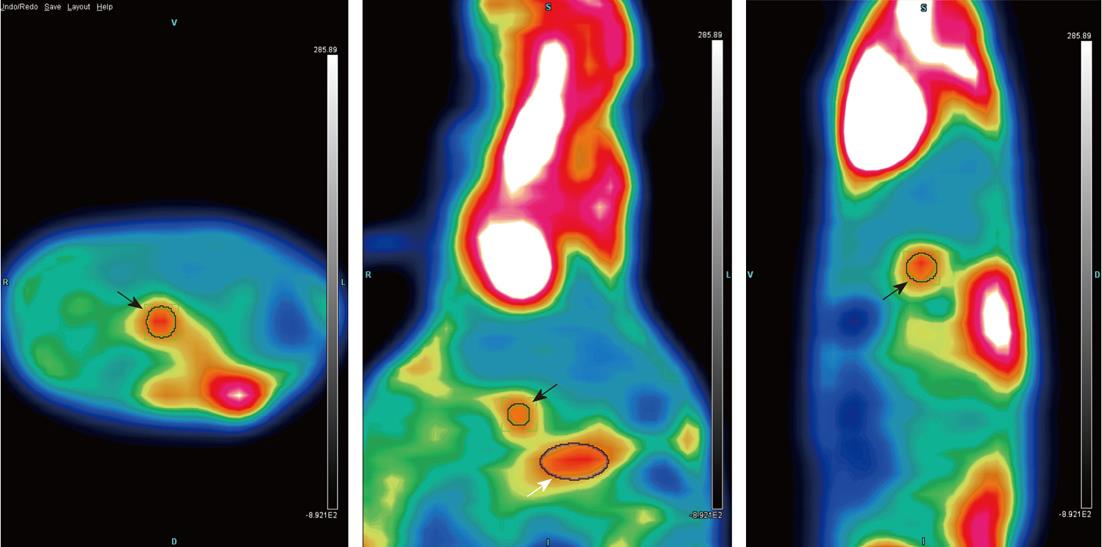
Figure 7 Positron emission tomography-computed tomography scan of mice from tumor cell microencapsulation group.
White arrow points to the primary tumor, and black arrows point to metastasis lesions.
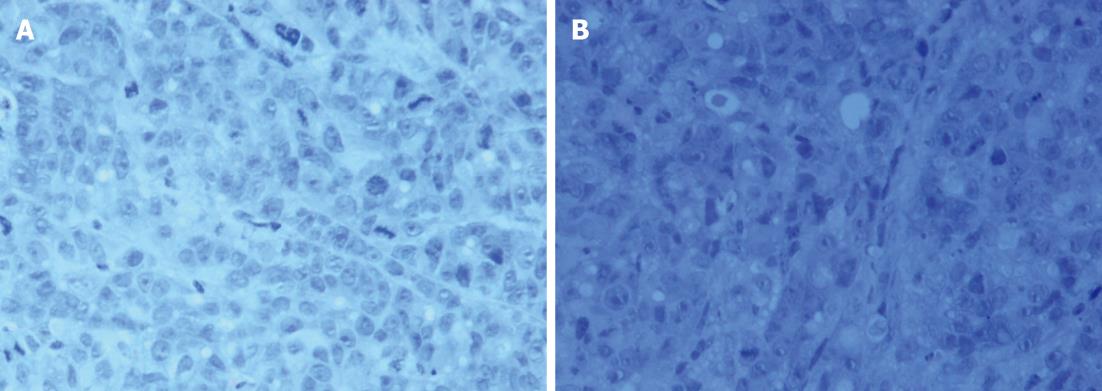
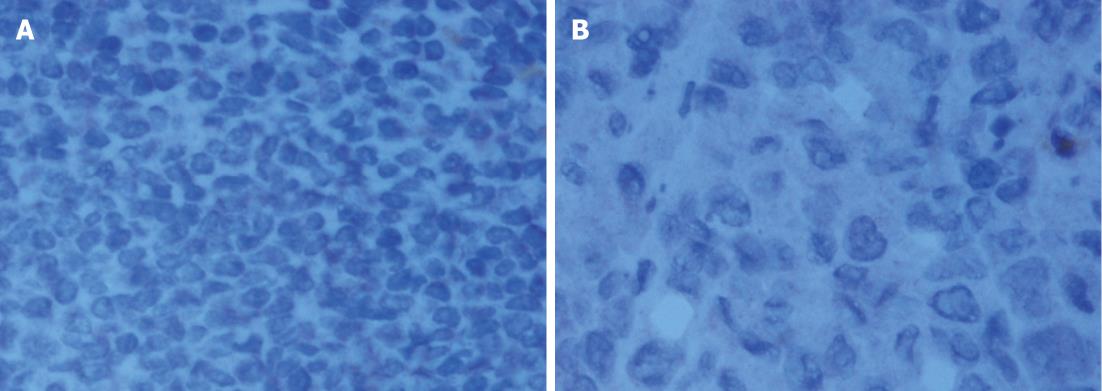
Figure 8 Hematoxylin and eosin staining of tumors.
A: Single tumor cells; B: Microcapsules.
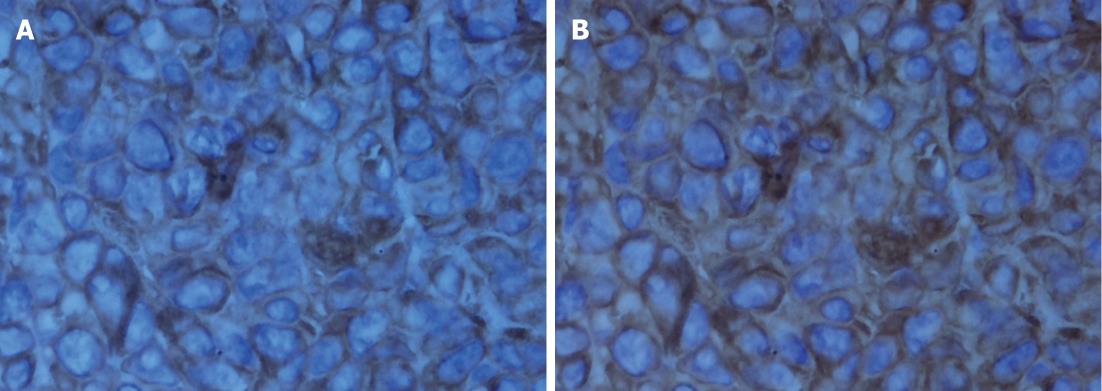
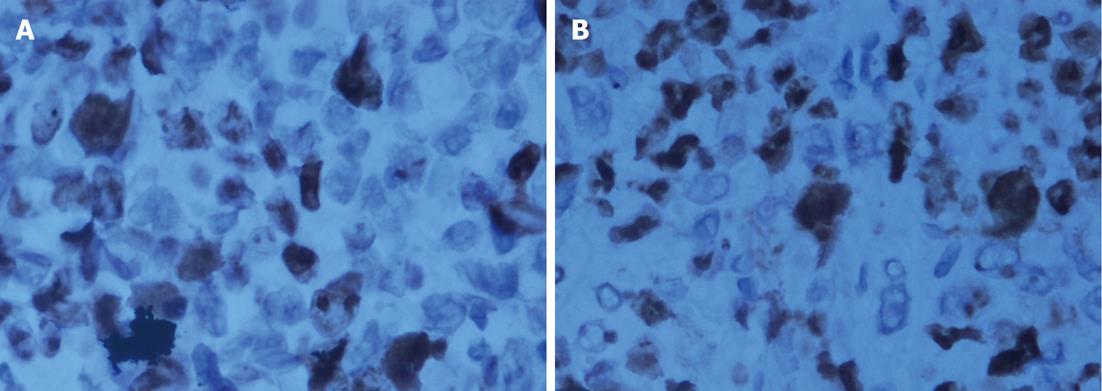
Figure 9 AE1AE3 immunohistochemical staining of tumors.
A: Single tumor cells, AE1AE3 (+); B: Microcapsules, AE1AE3 (++).
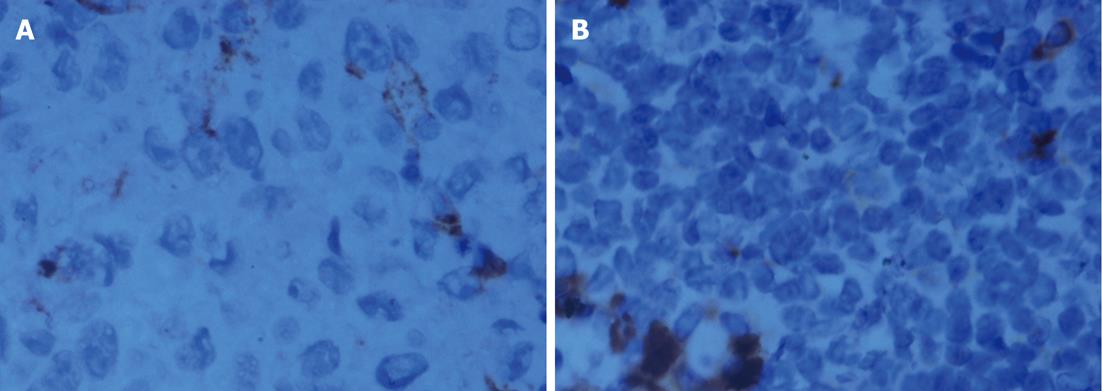
Figure 10 Carbohydrate antigen 19-9 immunohistochemical staining of tumors.
A: Single tumor cells, carbohydrate antigen 19-9 (a few +); B: Microcapsules, CA199 (a few ++).
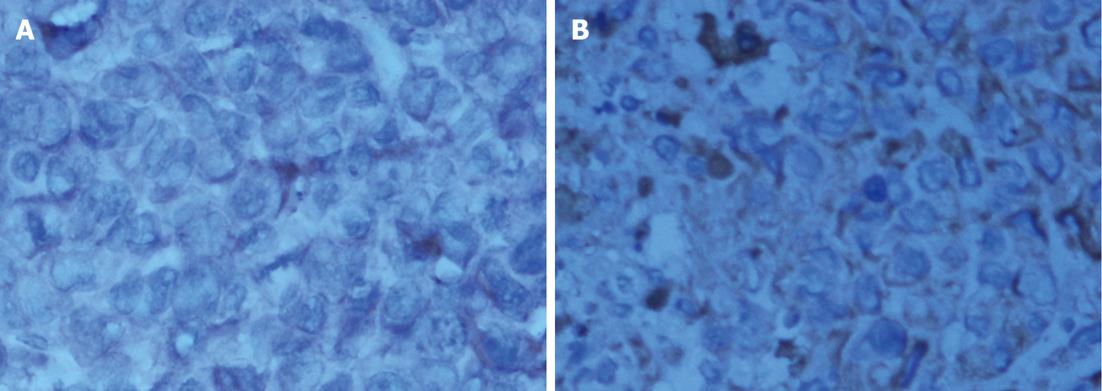
Figure 11 CAM 5.
2 immunohistochemical staining of tumors. A: Single tumor cells, CAM 5.2 (+); B: Microcapsules, CAM 5.2 (+).
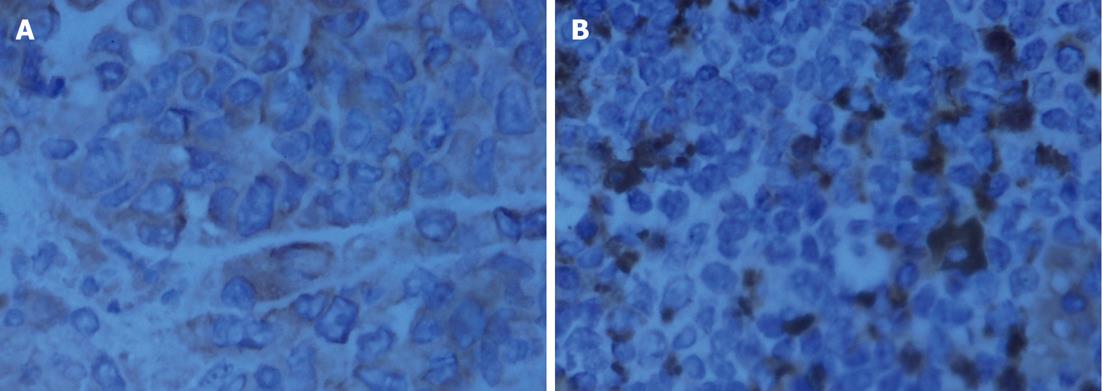
Figure 12 Epidermal growth factor receptor immunohistochemical staining of tumors.
A: Single tumor cells, epidermal growth factor receptor (EGFR) (+); B: Microcapsules, EGFR (++).
Figure 13 MIB-1 immunohistochemical staining of tumors.
A: Single tumor cells, MIB-1 (60%); B: Microcapsules, MIB-1 (60%).
Figure 14 VIM immunohistochemical staining of tumors.
A: Single tumor cells, VIM (-); B: Microcapsules, VIM (-).
- Citation: Ma MZ, Cheng DF, Ye JH, Zhou Y, Wang JX, Shi MM, Han BS, Peng CH. Microencapsulated tumor assay: Evaluation of the nude mouse model of pancreatic cancer. World J Gastroenterol 2012; 18(3): 257-267
- URL: https://www.wjgnet.com/1007-9327/full/v18/i3/257.htm
- DOI: https://dx.doi.org/10.3748/wjg.v18.i3.257


