Copyright
©2012 Baishideng Publishing Group Co.
World J Gastroenterol. Jan 21, 2012; 18(3): 225-236
Published online Jan 21, 2012. doi: 10.3748/wjg.v18.i3.225
Published online Jan 21, 2012. doi: 10.3748/wjg.v18.i3.225
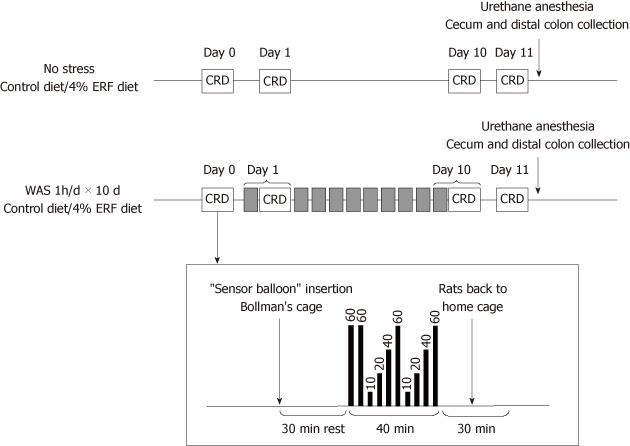
Figure 1 Treatment and colorectal distension (black column with number in mmHg) protocol for the assessment of visceral pain in Wistar rats exposed to daily intermittent water avoidance stress.
Grey boxes represent the daily sessions of water avoidance stress (1 h). ERF: Enzyme-treated rice fiber; CRD: Colorectal distension.
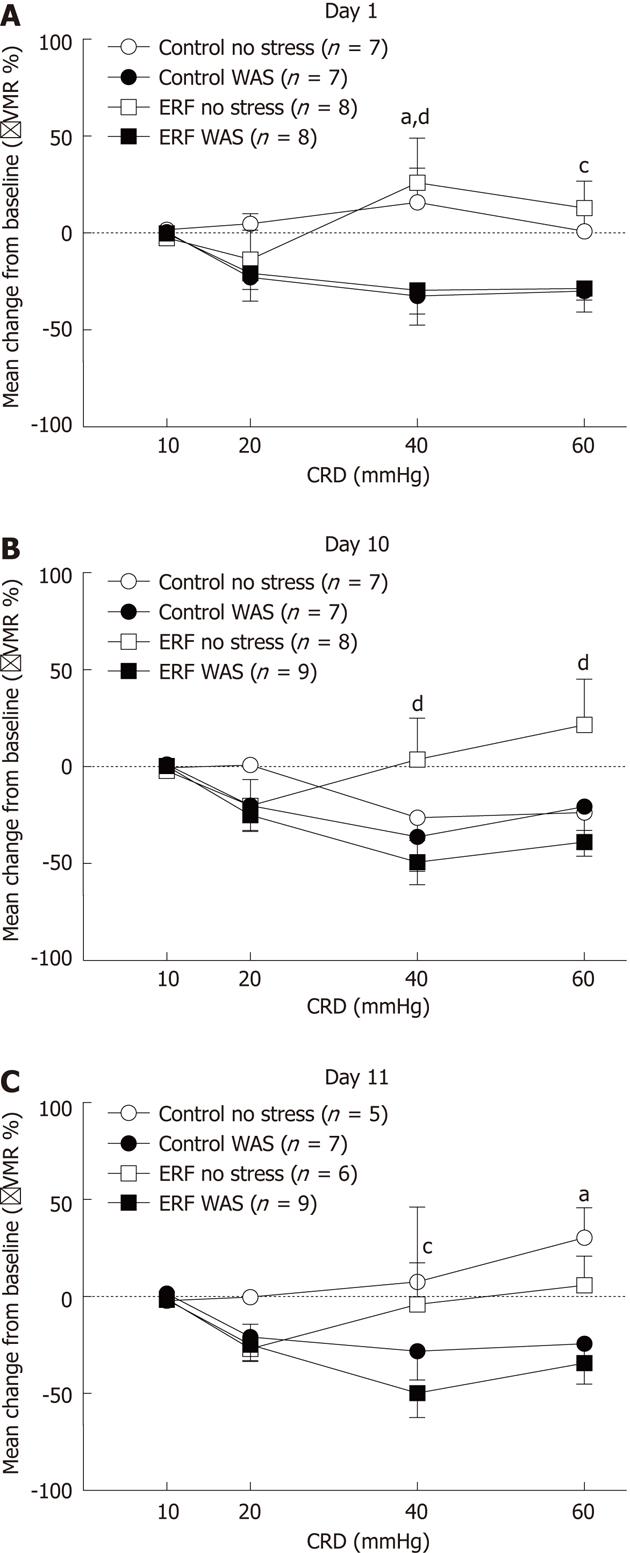
Figure 2 Influence of water avoidance stress or no stress on visceral sensitivity to colorectal distension in rats fed standard or prebiotic (4% enzyme-treated rice fiber) diet ad libitum.
A: Immediate visceral motor response (VMR) at day 1; B: Immediate VMR at day 10; C: VMR 24 h at day 11. Data are expressed as mean ± SE of number of animals indicated in parenthesis for each group. aP < 0.05 standard diet no stress vs standard diet water avoidance stress (WAS); cP < 0.05, dP < 0.01 enzyme-treated rice fiber (ERF) no stress vs ERF WAS; 2-way ANOVA followed by Bonferroni post hoc test. CRD: Colorectal distention.
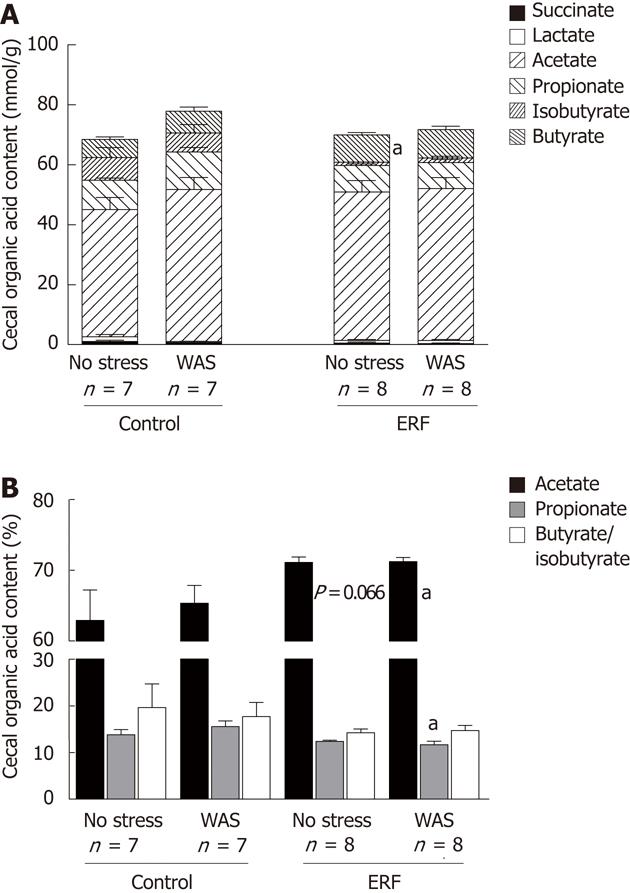
Figure 3 Cecal organic acid content in mmol/L per g (A) or % (B) in rats fed either standard or 4% enzyme-treated rice fiber prebiotic diet and exposed or not to repeated water avoidance stress in rats.
Data are expressed as mean ± SE, of number of rats indicated as n below columns. aP < 0.05 vs control diet same stress status group; unpaired student t test. WAS: Water avoidance stress; CRD: Colorectal distention.
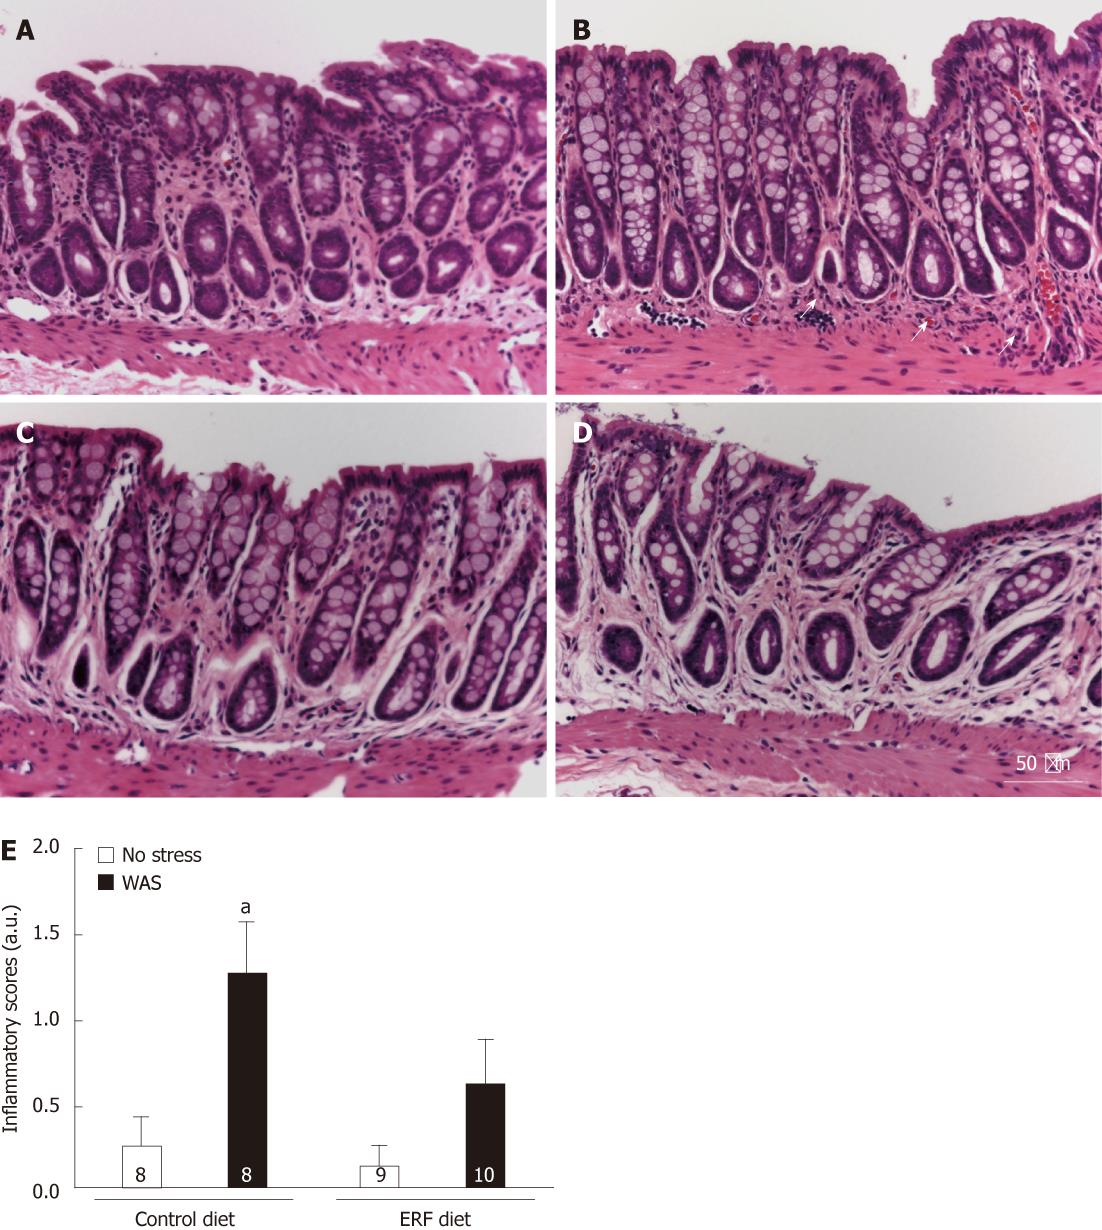
Figure 4 Inflammatory scores in distal colon of rats fed either standard or 4% enzyme-treated rice fiber diet and exposed or not (no stress) to repeated water avoidance stress.
A-D: Representative histological sections of the rat distal colon stained with hematoxylin and eosin. The arrows point to an area in the lamina propria with inflammatory cell infiltration in stressed rats fed with standard diet (B) that was not observed in non-stressed rats fed with standard (A) or 4% enzyme-treated rice fiber (ERF) (C) diet and stressed rats fed with 4% ERF diet (D). E: Inflammatory scores. Data are expressed as mean ± SE, of number of rats indicated as n in each column. aP < 0.05 vs opposite diet same stress status group; unpaired student t test. WAS: Water avoidance stress; a.u.: Arbitrary unit.
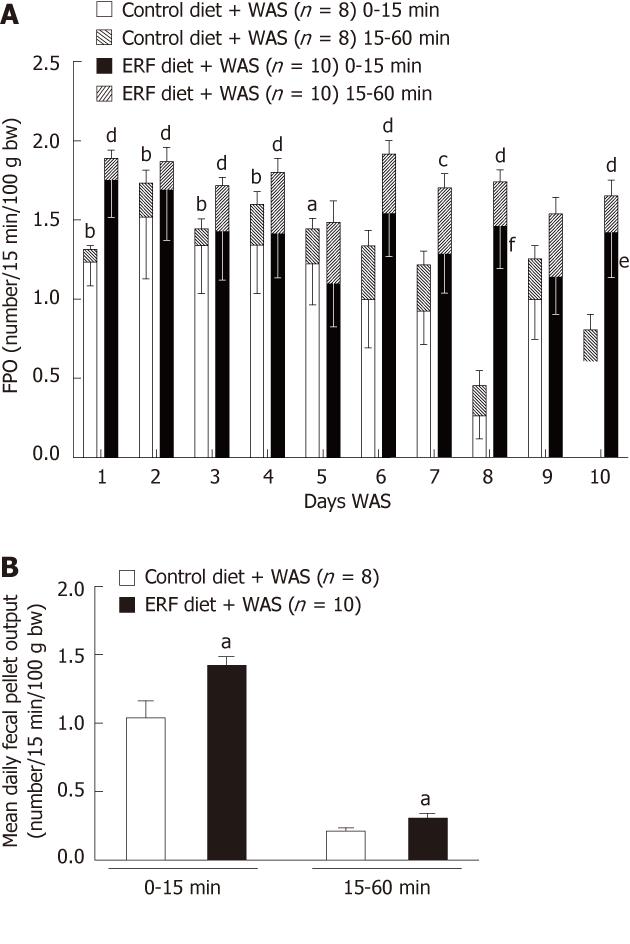
Figure 5 Defecation induced by repeated water avoidance stress in rats fed either standard or 4% enzyme-treated rice fiber prebiotic diet.
A: Time-course of hourly defecation expressed as number/15 min per 100 g of body weight for 0-15 min and 15-60 min time periods over the 10 d of 1-h water avoidance stress (WAS). aP < 0.05, bP < 0.01 vs standard diet interval 0-15 min; cP < 0.05, dP < 0.01 vs enzyme-treated rice fiber (ERF) diet interval 0-15 min; eP < 0.05, fP < 0.01 vs standard diet interval 0-15 min; 2-way ANOVA followed by Bonferroni post hoc test; B: Mean daily defecation expressed as number/15 min/100 g of body weight for 0-15 min and 15-60 min intervals. aP < 0.05 vs control diet same time interval; unpaired student t test. Data are expressed as mean ± SE, n as indicated in parenthesis for each group. FPO: Fecal pellet output.
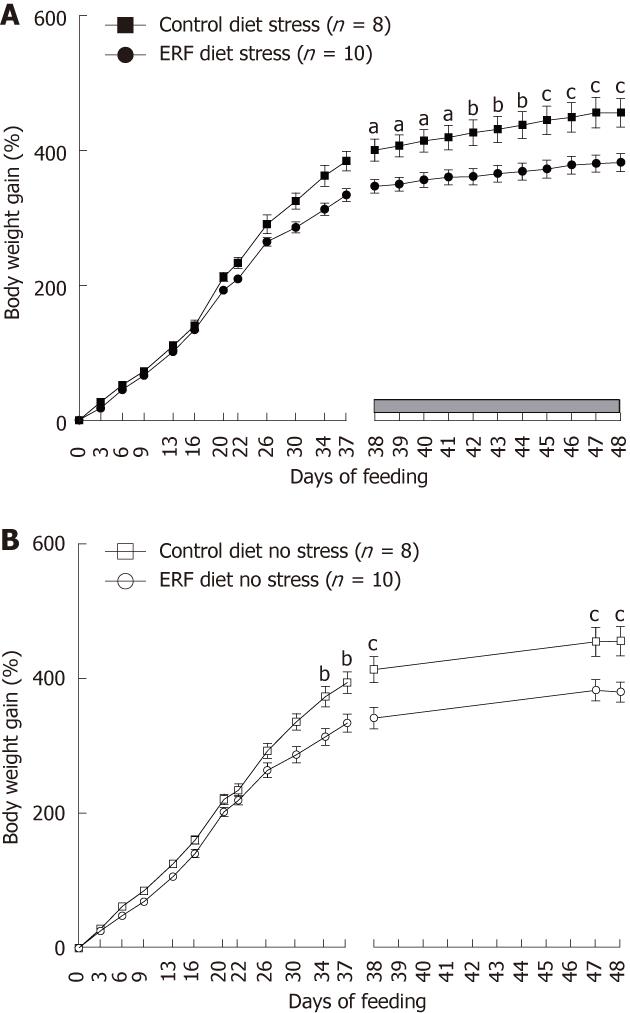
Figure 6 Body weight gain in rats fed either standard or 4% enzyme-treated rice fiber prebiotic diet: influence of repeated water avoidance stress.
Rat body weight gain from weaning age (day 21) and during 37 d followed by 10 d of water avoidance stress (WAS) (A) or not (B). Data are expressed as mean ± SE, n as indicated in parenthesis for each group. aP < 0.05, bP < 0.01, cP < 0.001 vs enzyme-treated rice fiber (ERF) diet group; 2-way ANOVA followed by Bonferroni post hoc test.
- Citation: Larauche M, Mulak A, Yuan PQ, Kanauchi O, Taché Y. Stress-induced visceral analgesia assessed non-invasively in rats is enhanced by prebiotic diet. World J Gastroenterol 2012; 18(3): 225-236
- URL: https://www.wjgnet.com/1007-9327/full/v18/i3/225.htm
- DOI: https://dx.doi.org/10.3748/wjg.v18.i3.225


