Copyright
©2012 Baishideng Publishing Group Co.
World J Gastroenterol. Mar 14, 2012; 18(10): 1077-1084
Published online Mar 14, 2012. doi: 10.3748/wjg.v18.i10.1077
Published online Mar 14, 2012. doi: 10.3748/wjg.v18.i10.1077
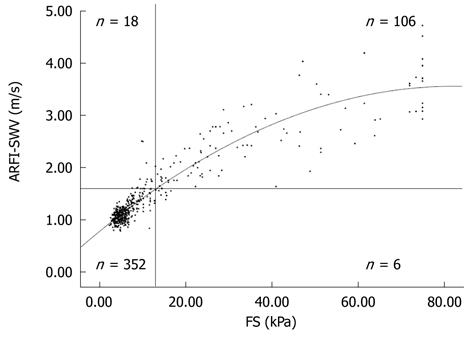
Figure 1 Correlation of acoustic radiation force impulse with FibroScan (r = 0.
920; P < 0.001).The vertical line represents the cut-off value of 13 kPa for FS and the horizontal line represents the cut-off value of 1.60 m/s for acoustic radiation force impulse (n = 482); using the cut-off value of 1.60 for the discrimination of liver fibrosis from liver cirrhosis for acoustic radiation force impulse imaging shear wave velocity, 458 of the 482 patients (95.1%) were classified correctly. Six (1.2%) patients were classified false-negative (FS-LS ≥ 13 kPa and acoustic radiation force impulse imaging shear wave velocity < 1.60 m/s), and 18 (3.7%) were classified false-positive (FS-LS < 13 kPa and ARFI-SWV ≥1.60 m/s. FS: FibroScan©.
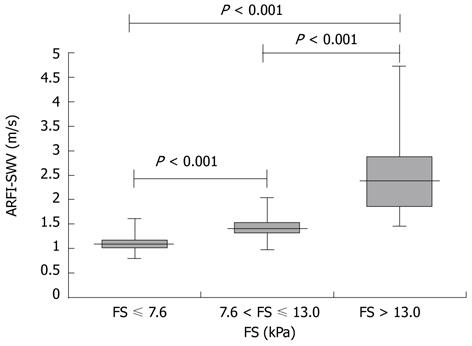
Figure 2 Acoustic radiation force impulse imaging shear wave velocity for the different stages of fibrosis.
Box plots show median values with 25th and 75th percentiles of shear wave velocity determined by acoustic radiation force impulse. (FS ≤ 7.6 kPa: No significant fibrosis; 7.6 kPa < FS ≤ 13.0 kPa: Significant fibrosis; FS > 13.0 kPa: Liver cirrhosis).
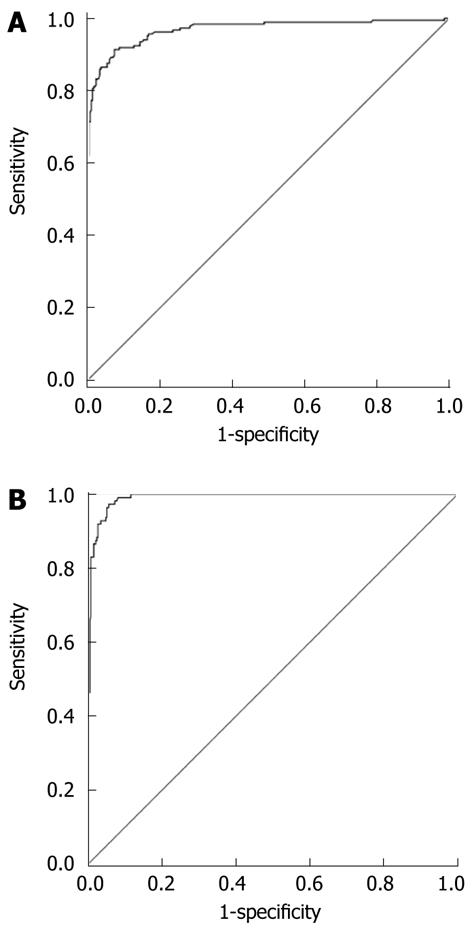
Figure 3 Receiver operator characteristic curve for acoustic radiation force impulse for the prediction of no significant fibrosis and liver cirrhosis (n = 482).
A: Receiver operator characteristic curve for acoustic radiation force impulse for the prediction of no significant fibrosis (FS < 7.6 kPa); B: Receiver operator characteristic curve for acoustic radiation force impulse for the prediction of liver cirrhosis (FS > 13.0 kPa).
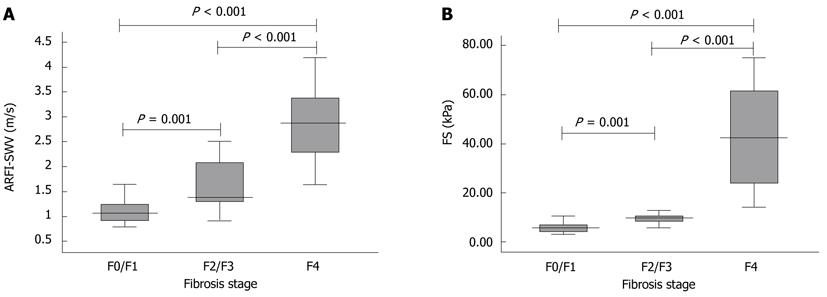
Figure 4 Acoustic radiation force impulse imaging shear wave velocity and liver stiffness measured by transient elastography for the different fibrosis stages in patients who underwent liver biopsy (F0/F1, F2/F3, and F4).
A: ARFI-SWV for the different fibrosis stages in patients who underwent liver biopsy. Box plots show median values with 25th and 75th percentiles of shear wave velocity determined by ARFI (n = 68); B: FS-LS for the different fibrosis stages in patients who underwent liver biopsy (F0/F1, F2/F3, and F4). Box plots show median values with 25th and 75th percentiles of FS-LS (n = 59). ARFI-SWV: Acoustic radiation force impulse imaging shear wave velocity; FS-LS: Liver stiffness measured by transient elastography.
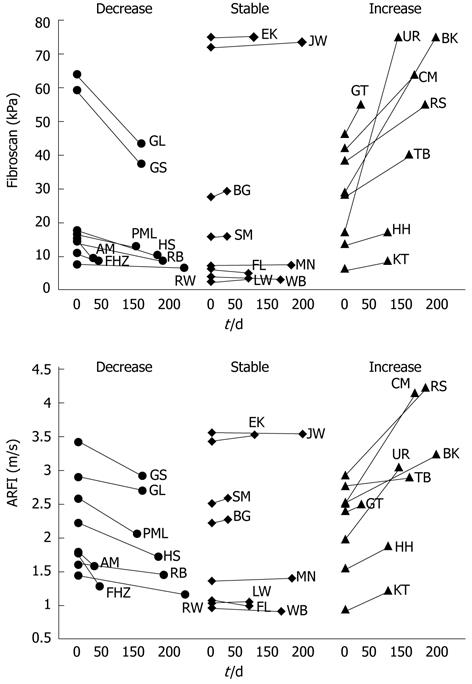
Figure 5 Behaviour of acoustic radiation force impulse imaging shear wave velocity over time in 24 patients, in which FS-LS remained constant, increased or decreased over time (8 patients in each group).
FS-LS: Liver stiffness measured by transient elastography.
- Citation: Kircheis G, Sagir A, Vogt C, vom Dahl S, Kubitz R, Häussinger D. Evaluation of acoustic radiation force impulse imaging for determination of liver stiffness using transient elastography as a reference. World J Gastroenterol 2012; 18(10): 1077-1084
- URL: https://www.wjgnet.com/1007-9327/full/v18/i10/1077.htm
- DOI: https://dx.doi.org/10.3748/wjg.v18.i10.1077


