Copyright
©2012 Baishideng Publishing Group Co.
World J Gastroenterol. Mar 14, 2012; 18(10): 1048-1058
Published online Mar 14, 2012. doi: 10.3748/wjg.v18.i10.1048
Published online Mar 14, 2012. doi: 10.3748/wjg.v18.i10.1048
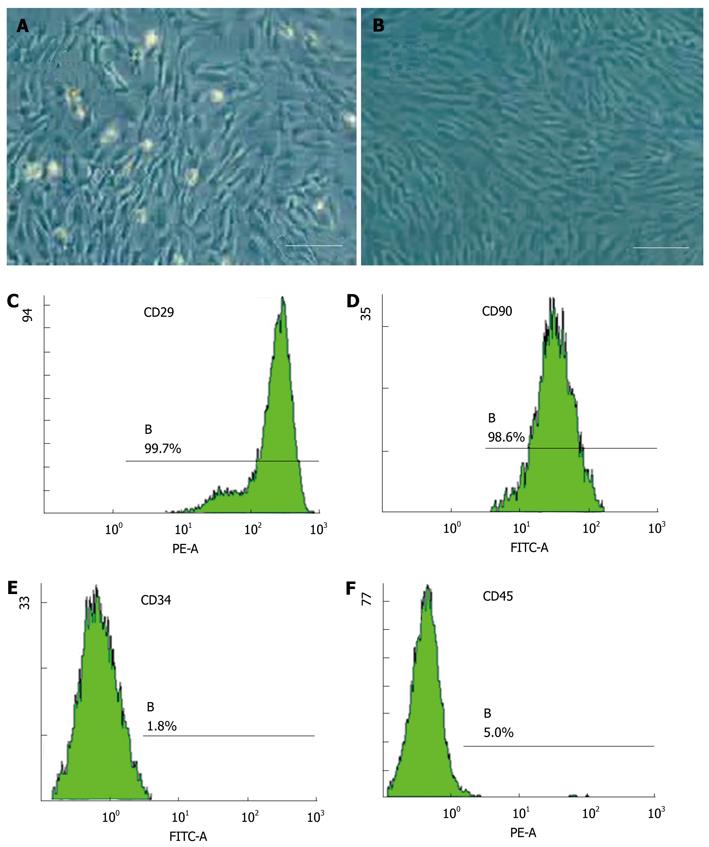
Figure 1 Mesenchymal stem cell culture and identification.
A: The morphology of mesenchymal stem cell (MSC) culture at 3 d (10 × 10 magnification); B: The morphology of MSCs approached 80% confluence (10 × 10 magnification); C: Fluorescence-activated cell sorting (FACS) analysis for MSC positive cell marker CD29; D: FACS analysis for MSC positive cell marker CD90; E: FACS analysis for MSC negative cell marker CD34; F: FACS analysis for MSC negative cell marker CD 45. Scale bars represent 100 mm. FITC: Fluorescein isothiocyanate; PE: Phycoerythrin.
Figure 2 Identification of mesenchymal stem cell transdifferentiation into hepatocytes.
Hepatocytes were used as positive control. A: Fluorescence immunostaining detection of α-fetoprotein (AFP) expression after 21 d induction in mesenchymal stem cells (MSCs) (10 × 40 magnification); B: Fluorescence immunostaining detection of albumin expression after 21 d induction in MSCs (10 × 40 magnification); C: Reverse transcription polymerase chain reaction detection of hepatocyte specific protein AFP, albumin and cytokeratin 18 (CK18) mRNA expression after 7, 14 and 21 d induction in MSCs. Scale bars represents 100 mm.
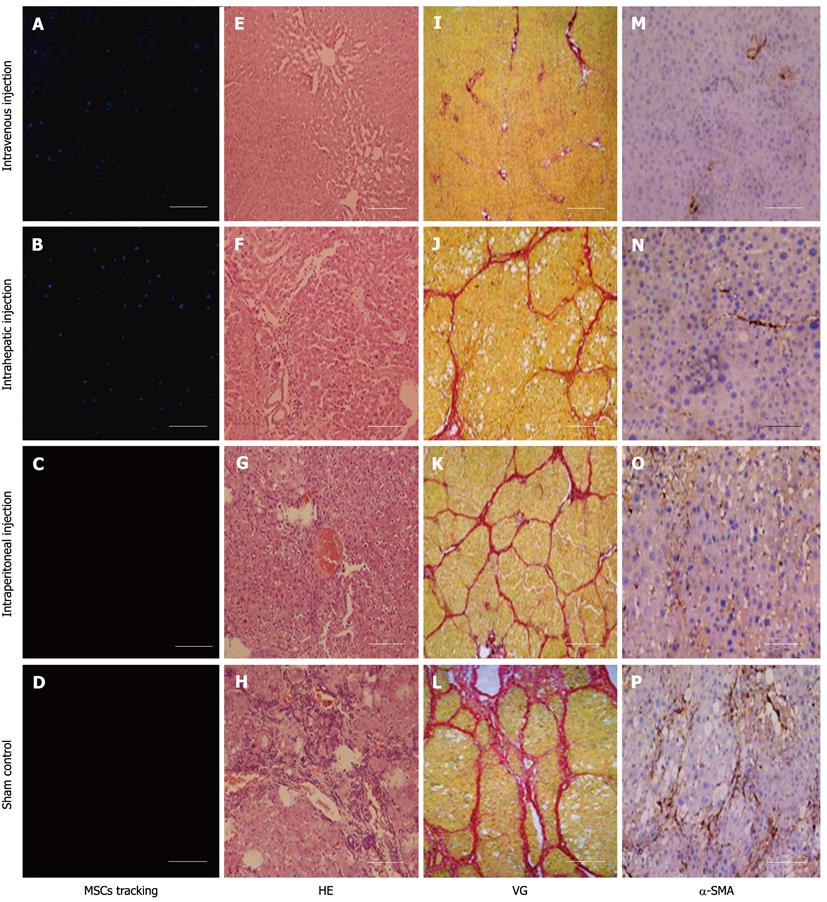
Figure 3 Comparison of liver treatment efficacy in different mesenchymal stem cell transplanted modalities.
All figures are 10 × 10 magnification. Scale bars represent 100 mm. A, B, C and D: Fluorescence tracked 4',6-diamidino-2-phenylindole (DAPI)-labeled mesenchymal stem cells (MSCs) in liver. Blue dots are DAPI-labeled MSCs; A: MSC intravenous injection, and many DAPI-labeled cells can also be seen distributed in liver; B: MSC intrahepatic injection, and many DAPI-labeled cells can also be seen distributed in liver; C: MSC intraperitoneal injection, and few labeled cells can be seen in liver; D: MSC non-treated liver fibrosis; E, F, G and H: Hematoxylin and eosin (HE) analysis for detecting liver extracellular matrix (ECM) arrangement in liver fibrosis; E: MSC intravenous injection, and liver ECM arrangement was similar to normal liver; F and G: MSC intrahepatic and intraperitoneal injection, and ECM arrangement was disordered in both groups; H: MSC non-treated liver fibrosis; I, J, K and L: Van Gieson's (VG) staining analysis for detecting collagen in liver fibrosis; I: MSC intravenous injection, and little positive staining was detected; J and K: MSC intrahepatic and intraperitoneal injection, and a large number of collagen was deposited in liver lobules; K: MSC non-treated liver fibrosis; M, N, O and P: Immunohistochemical analysis for detecting the expression of the marker of myofibroblasts, alpha-smooth muscle actin (α-SMA); M: MSC intravenous injection, and there was no immunoreactivity in this group; N and O: MSC intrahepatic and intraperitoneal injection, and a large amount of positive staining can be seen in both groups; P: MSC non-treated liver fibrosis.
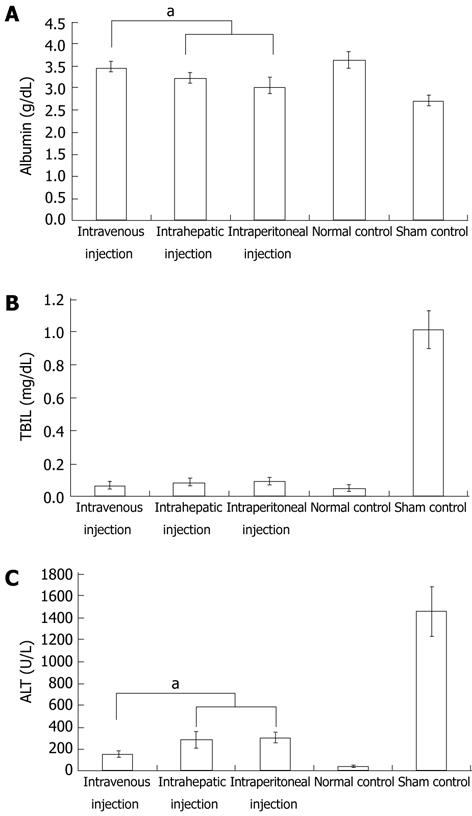
Figure 4 Quantitative analysis for hepatocyte specific protein expression by biochemical analysis to compare the liver fibrosis treatment efficacy of intravenous, intrahepatic and intraperitoneal mesenchymal stem cell injection.
Non-treated carbon tetrachloride (CCl4) group acted as normal control. Rats not injected with mesenchymal stem cells (MSCs) after CCl4 processing were used as sham control. Data represent the mean ± SE, and aP < 0.05. A: Analysis for albumin expression; B: Analysis for total bilirubin in serum (TBIL) expression; C: Analysis for alanine aminotransferase (ALT) expression.
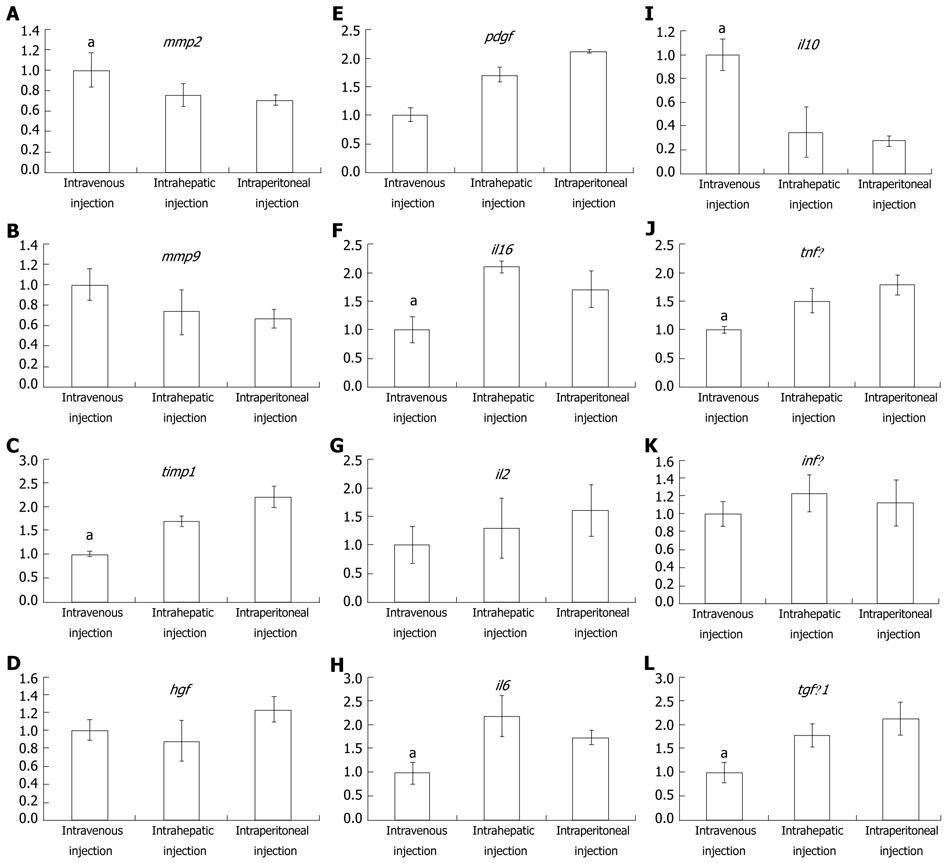
Figure 5 Real-time polymerase chain reaction analysis for detecting the expression difference of cytokines, growth factors and interleukin, which are involved in liver fibrosis progression, among different mesenchymal stem cell transplanted modalities.
The histogram shows the relative expression level for intravenous, intrahepatic and intraperitoneal injections. Data represent the mean ± SE, aP < 0.05. A and I: The expression of mmp2 and il10 in intravenous injection was significantly higher than other injection modalities; F, J, C, H and L: The expression of il1β, tnfα, timp1, il6 and tgfβ1 was significantly lower in intravenous injection than others; E, B, G, K and D: The expression of pdgf, mmp9, il2, hgf, infγ and hgf was not significantly different among the three mesenchymal stem cell injection modalities.
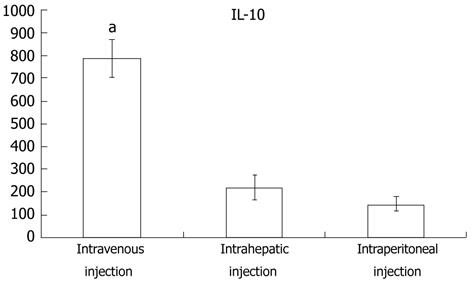
Figure 6 Enzyme linked immunosorbent assay analysis for detecting interleukin-10 protein expression in peripheral blood after intravenous, intrahepatic and intraperitoneal mesenchymal stem cell injection.
Values shown are mean ± SE, aP < 0.05. IL-10: Interleukin-10.
- Citation: Zhao W, Li JJ, Cao DY, Li X, Zhang LY, He Y, Yue SQ, Wang DS, Dou KF. Intravenous injection of mesenchymal stem cells is effective in treating liver fibrosis. World J Gastroenterol 2012; 18(10): 1048-1058
- URL: https://www.wjgnet.com/1007-9327/full/v18/i10/1048.htm
- DOI: https://dx.doi.org/10.3748/wjg.v18.i10.1048


