Copyright
©2011 Baishideng Publishing Group Co.
World J Gastroenterol. Aug 21, 2011; 17(31): 3605-3613
Published online Aug 21, 2011. doi: 10.3748/wjg.v17.i31.3605
Published online Aug 21, 2011. doi: 10.3748/wjg.v17.i31.3605
Figure 1 Ginsenoside Rg3 inhibits cell viability of human and murine liver cancer cells.
A: Concentration-dependent inhibitory effects of Ginsenoside Rg3 on cell viability in Hep1-6 and HepG2 cell lines. Cells were treated with Rg3 at 0, 50, 100, 200 μg/mL in 10% fetal bovine serum-supplemented medium for 24 h; cell viability was determined by 3-(4, 5-dimethylthiazol-2-yl)-2, 5-diphenyltetrazolium bromide assay (n = 6 for Hep1-6, n = 6 for HepG2). B: Time-dependent inhibitory effects of Rg3 on cell viability in Hep1-6 and HepG2 cell lines. Cells were treated with Rg3 100 μg/mL for 0, 6, 12, 24, 48 h. One-way ANOVA was performed to test the concentration and time-dependent effects. aP < 0.05 vs untreated controls.
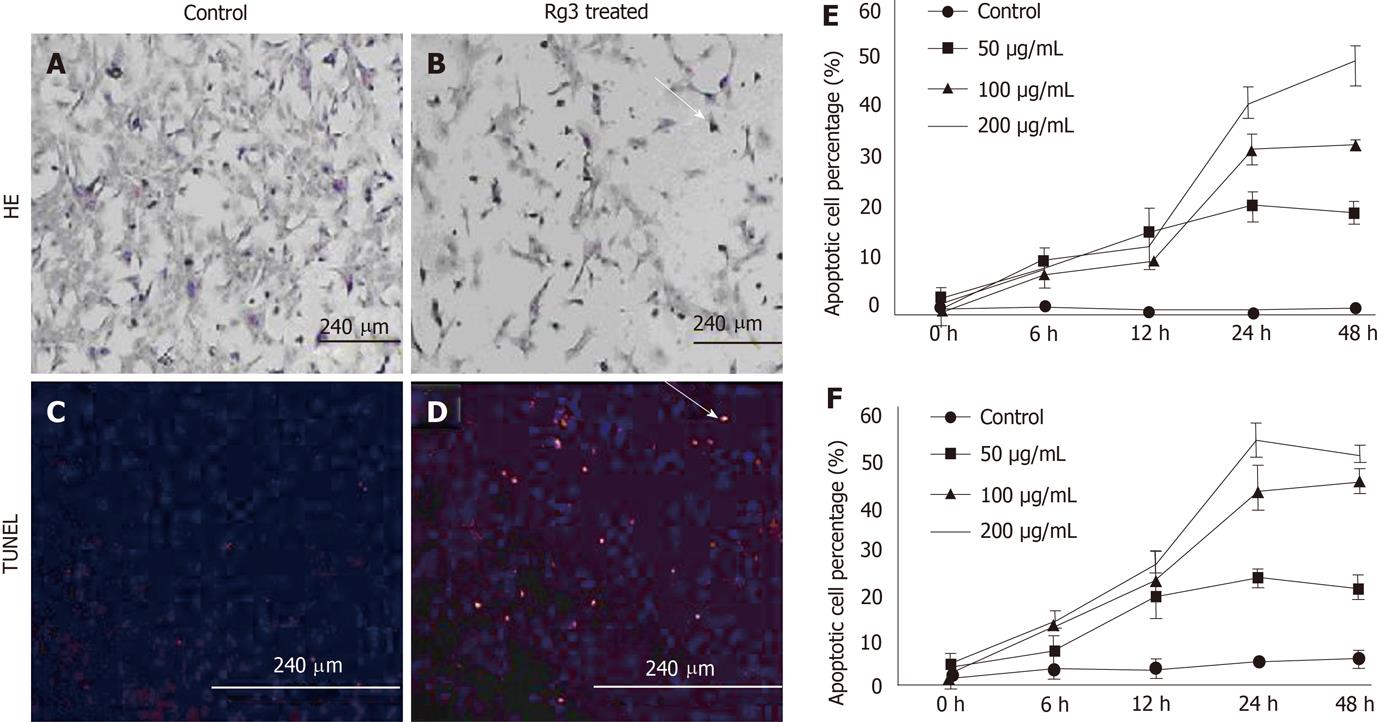
Figure 2 Ginsenoside Rg3 caused hepatocellular carcinoma morphological changes of apoptotic cells.
A, B: Cell apoptosis morphology was observed by hematoxylin and eosin (HE) stain. After 50 μg/mL Ginsenoside Rg3 (Rg3) incubation for 12 h, the Hep1-6 cells (B) indicate less survival cells compared to control group (A); C, D: DNA fragmentation in situ was detected by transferase-mediated dUTP-biotin nick end labeling. The control cells was stained blue (C) and the Rg3 treated group present apoptotic cells stained red (D); E, F: The apoptotic cells showed reduced volume and condensed chromatin. In both Hep1-6 and HepG2, the apoptotic induction effect is dose and time-dependent. Rg3: Ginsenoside Rg3; HE: Hematoxylin and eosin; TUNEL: Transferase-mediated dUTP-biotin nick end labeling.
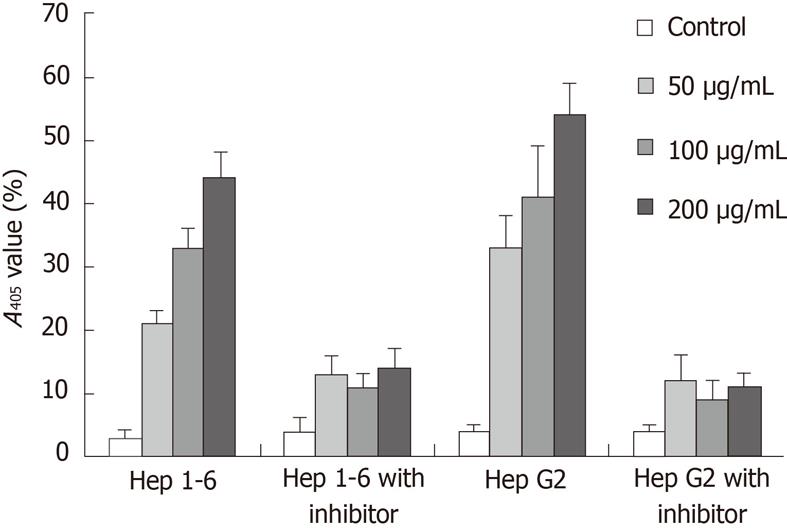
Figure 3 The caspase activity was measured by the chromophore p- nitroanilide.
Hep1-6 and HepG2 cells were pretreated with or without 20 mm z-DEVD-FMK for 1 h, and then cultured with 0, 50, 100, 200 μg/mL ginsenoside Rg3 for 24 h. The caspase activity was measured by the chromophore p-nitroanilide (pNA) after cleavage from the labeled substrate DEVD-pNA by a plate reader A405 nm.
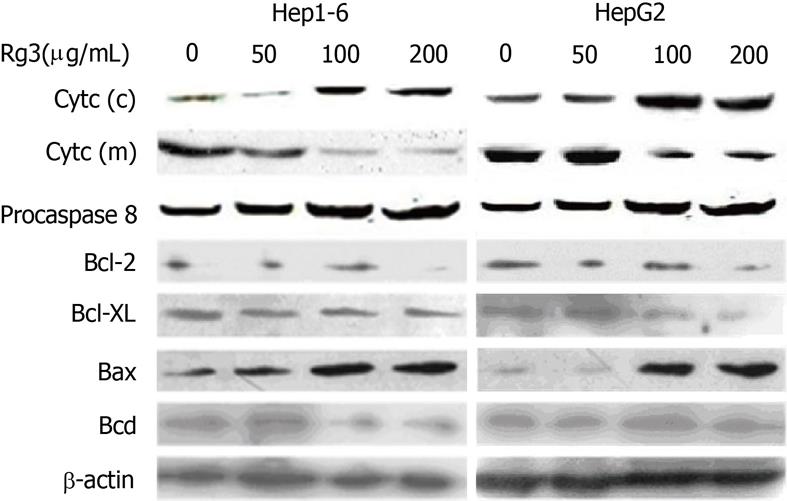
Figure 4 Effects of ginsenoside Rg3 on the cytochrome c release, caspase 8 cleavage and Bcl2-family.
Hep1-6 and HegG2 cells were treated with 0, 50, 100, 200 μg/mL ginsenoside Rg3 (Rg3) for 24 h, and western-blot was used to detect the pro-casepase-8, cytochrome c in cytosolic fractions (c) and mitochondria fractions (m), Bcl-2, Bcl-XL, Bax, and Bad. β-actin is the protein loading control. Pro-caspase-8 remains static with or without Rg3 treatment. Cytochrome c decreased in the mitochondrial fraction and increased in the cytosolic fraction. Bcl-2 and Bcl-XL were down-regulated while Bax was up-regulated. Bad remains unchanged in the cells with and without Rg3 treatment. Rg3: Ginsenoside Rg3.
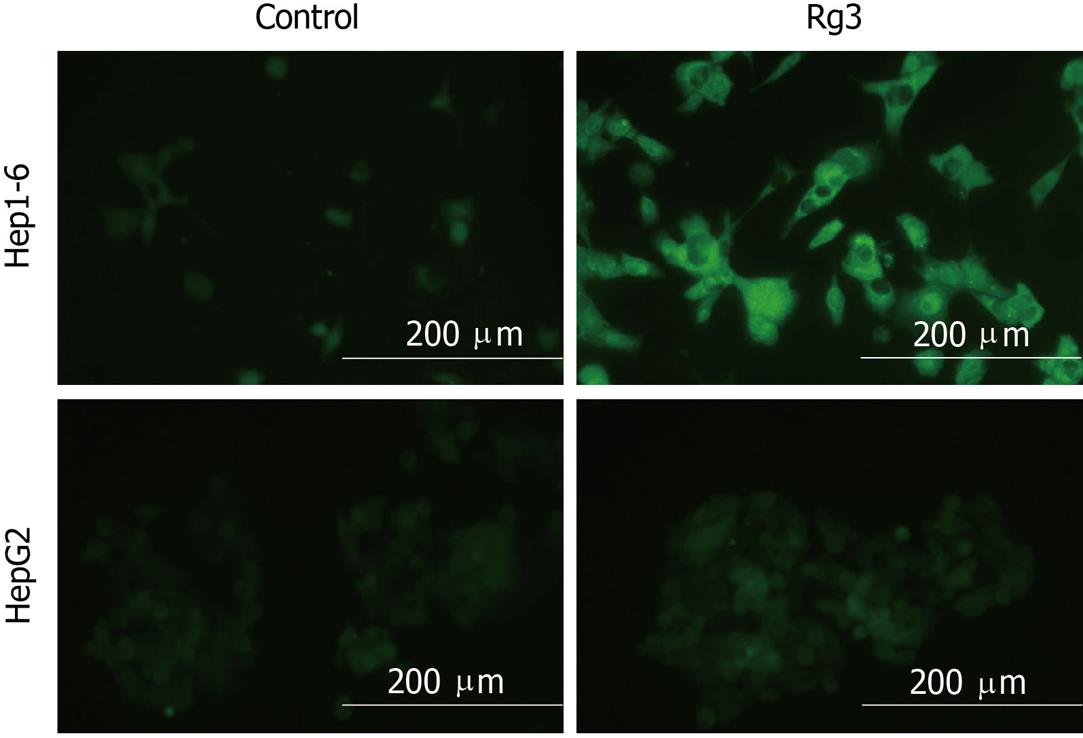
Figure 5 Hep1-6 and HepG2 cells were treated with Rg3 100 μg/mL or saline for 24 h then cells were stained with 5, 5’, 6, 6’ - tetrachloro-1, 1’, 3, 3’ - tetraethylbenzimidazolylcarbocyanine iodide dye.
Depolarized mitochondrial membranes were detected by the presence of a diffuse green fluorescence. Ginsenoside Rg3 treated groups had a significantly higher percentage of green fluorescent cells: Hep1-6 (87% ± 6% vs control 2% ± 1%) and HepG2 (46% ± 4% vs control 3% ± 2%). Rg3: Ginsenoside Rg3. aP < 0.05 vs control group.
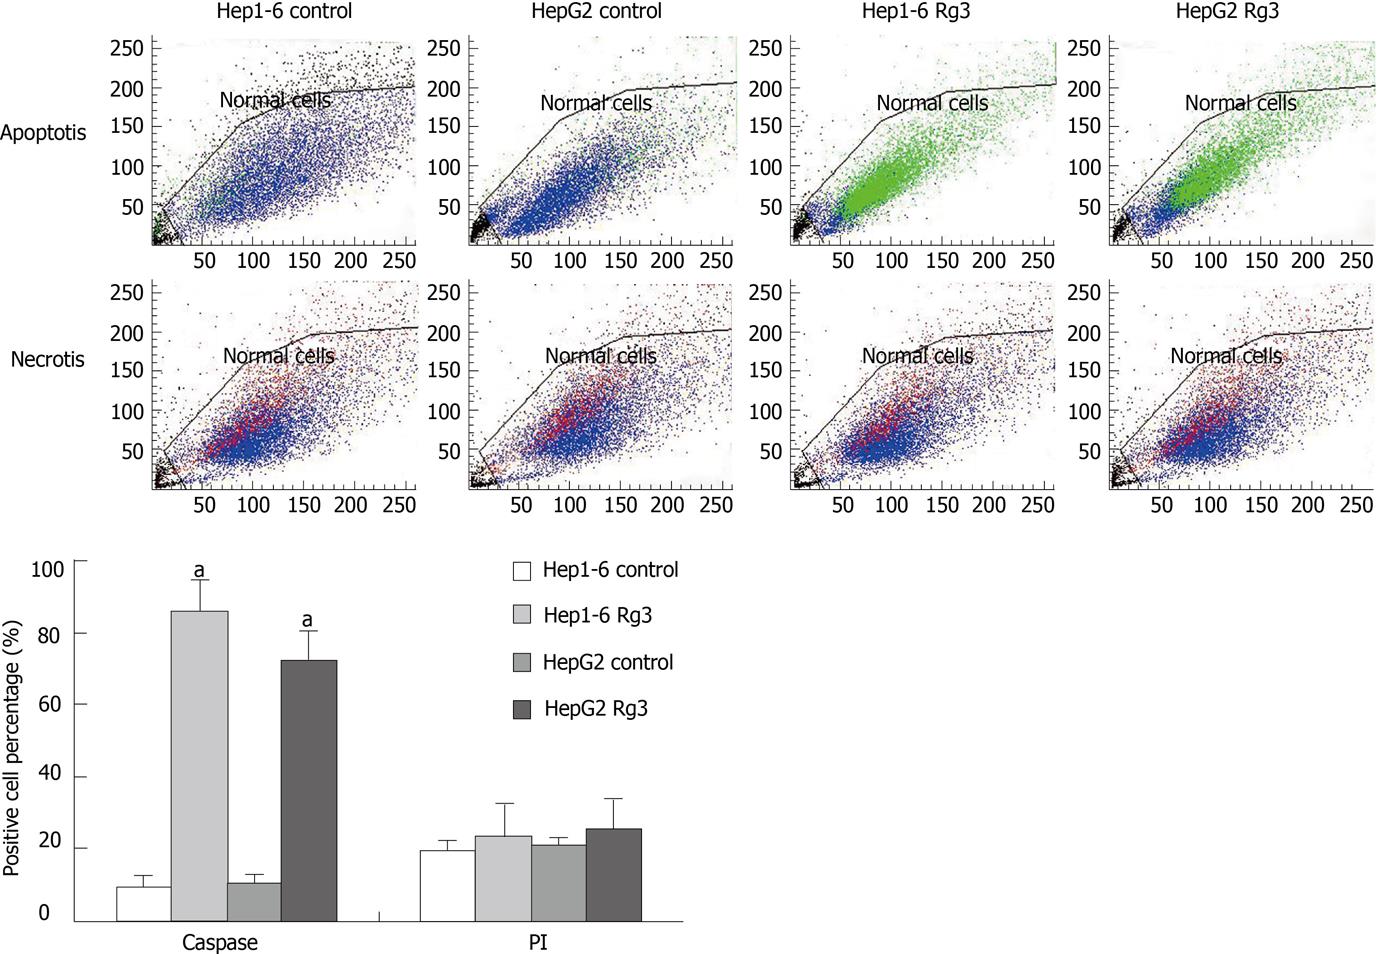
Figure 6 Flow cytometry after caspase-3-fluorescein isothiocyanate/propidium Iodide staining.
After being treated by ginsenoside Rg3 (Rg3) 100 μg/mL or saline for 24 h, Hep1-6 and HepG2 cells were stained by caspase-3-fluorescein isothiocyanate (FITC) and propidium Iodide (PI). Viable cells are shown as blue and early apoptotic cells are green (caspase-3-FITC). The non-viable necrotic cells are red (PI). Rg3 treated groups had a significantly higher percentage of caspase-3 positive cells: Hep1-6 (85% ± 9% vs 9% ± 3%) and HepG2 (71% ± 8% vs 11% ± 2%). There are no statistical difference in PI staining between Rg3 treated group and control group: Hep1-6 (23% ± 3% vs 19% ± 2%) and HepG2 (25% ± 4% vs 21% ± 3%). Rg3: Ginsenoside Rg3. aP < 0.05 vs control group.
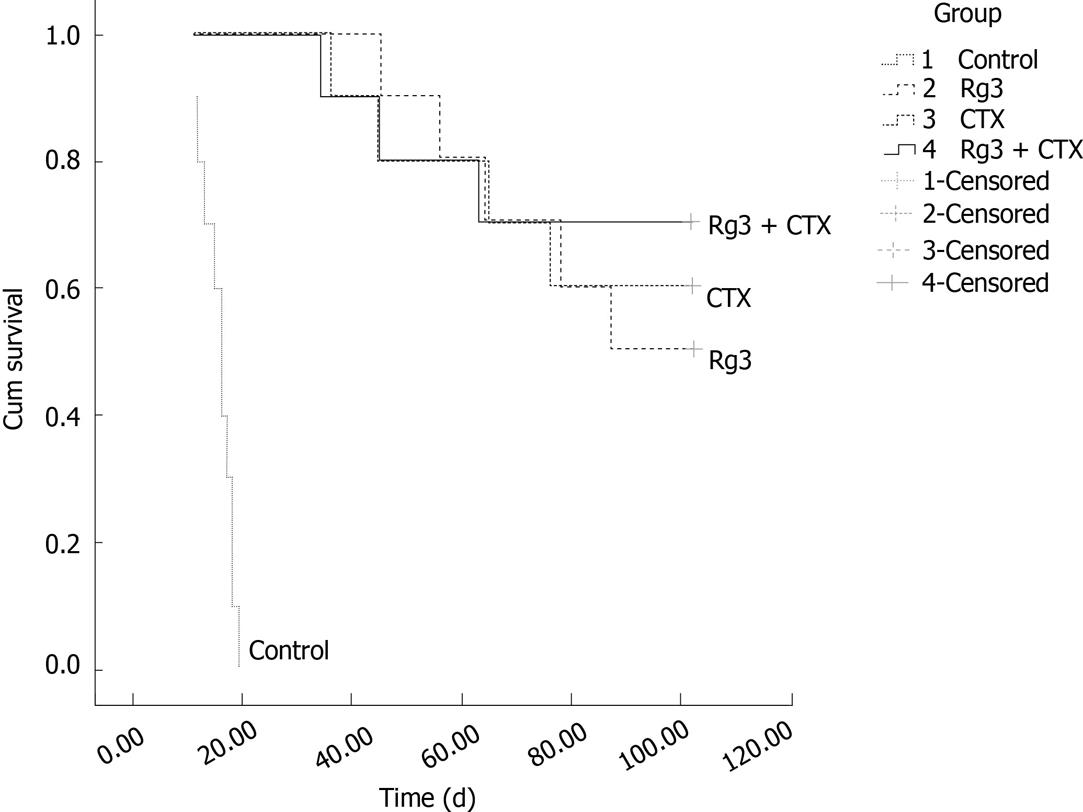
Figure 7 Survival time and survival rate of mice bearing hep1-6 tumor.
The forty mice were divided into 4 groups with ten in each group, and inoculated with 1 × 10⁶ Hep1-6 cells in each mouse. The mice were given an intratumoral injection of ginsenoside Rg3 (Rg3) (3.0 mg/kg) and cyclophosphamide (CTX ) (20.0 mg/kg) or saline (1.5 mg/kg) for 10 d following inoculation of Hep1-6 cells. The animal survival study was followed up to 102 d, to observe and compare their survival time and survival rate. The Rg3 and CTX combination group, Rg3 group, and CTX group were statistically significant compared with the saline injected control group. Rg3: Ginsenoside Rg3; CTX: cyclophosphamide.
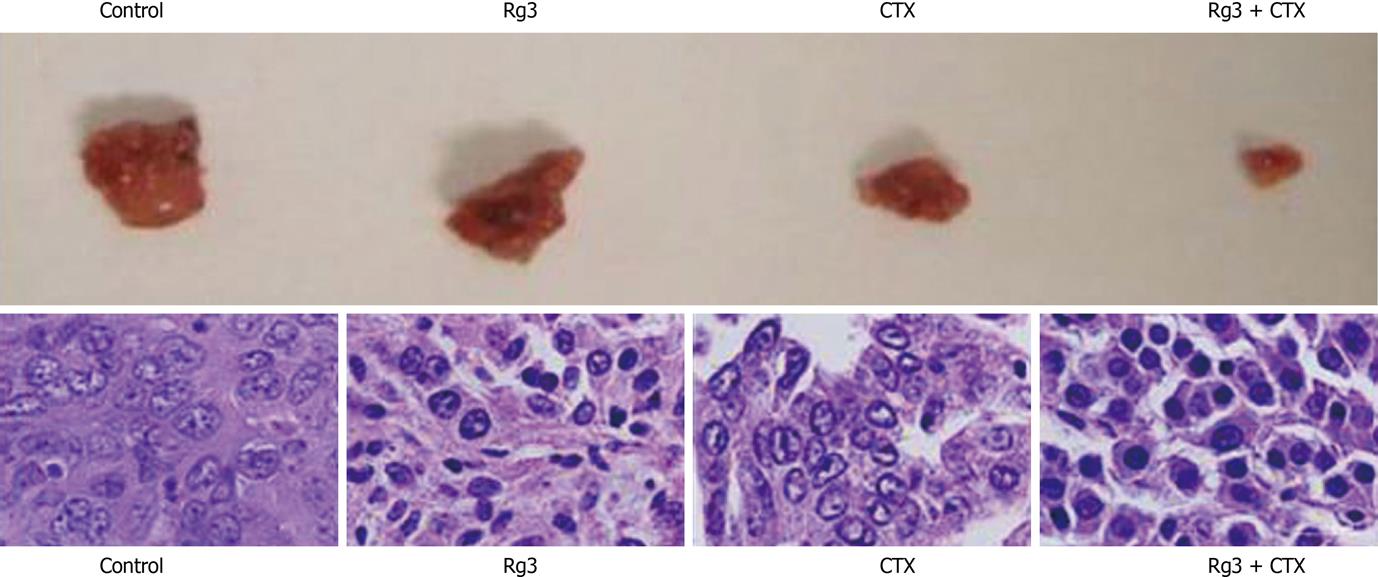
Figure 8 Tumor grosses dissection and histology.
Tumors were dissected immediately after the mice were euthanized. Tumor blood vessels and their wall were abundant in the control group. The Ginsenoside Rg3 (Rg3) and cyclophosphamide (CTX) group showed smaller tumor size. The CTX group had the necrosis in the center. Rg3 + CTX had the smallest volume without necrosis. Samples were stained with hematoxylin and eosin in succession. In the control group, moderately differentiated hepatocellular carcinoma cells were surrounded by thick fibrous capsule. The nuclei were large. In the Rg3 treated group, tumor cells were irregular and condensed. In the CTX treated group, the tumor cells lost connective tissue or blood supply. In Rg3 + CTX group, there was obvious chromatin condensation in the hepatocyte. Rg3: Ginsenoside Rg3; CTX: Cyclophosphamide.
-
Citation: Jiang JW, Chen XM, Chen XH, Zheng SS. Ginsenoside Rg3 inhibit hepatocellular carcinoma growth
via intrinsic apoptotic pathway. World J Gastroenterol 2011; 17(31): 3605-3613 - URL: https://www.wjgnet.com/1007-9327/full/v17/i31/3605.htm
- DOI: https://dx.doi.org/10.3748/wjg.v17.i31.3605


