Copyright
©2011 Baishideng Publishing Group Co.
World J Gastroenterol. Aug 7, 2011; 17(29): 3459-3464
Published online Aug 7, 2011. doi: 10.3748/wjg.v17.i29.3459
Published online Aug 7, 2011. doi: 10.3748/wjg.v17.i29.3459
Figure 1 The borders of each of the tumors (arrows) are clearly defined.
A: Case 1; B: Case 2; C: Case 3. Ultrasonography showed a round hypoechoic mass (arrows) with a slightly heterogeneous internal echo level.
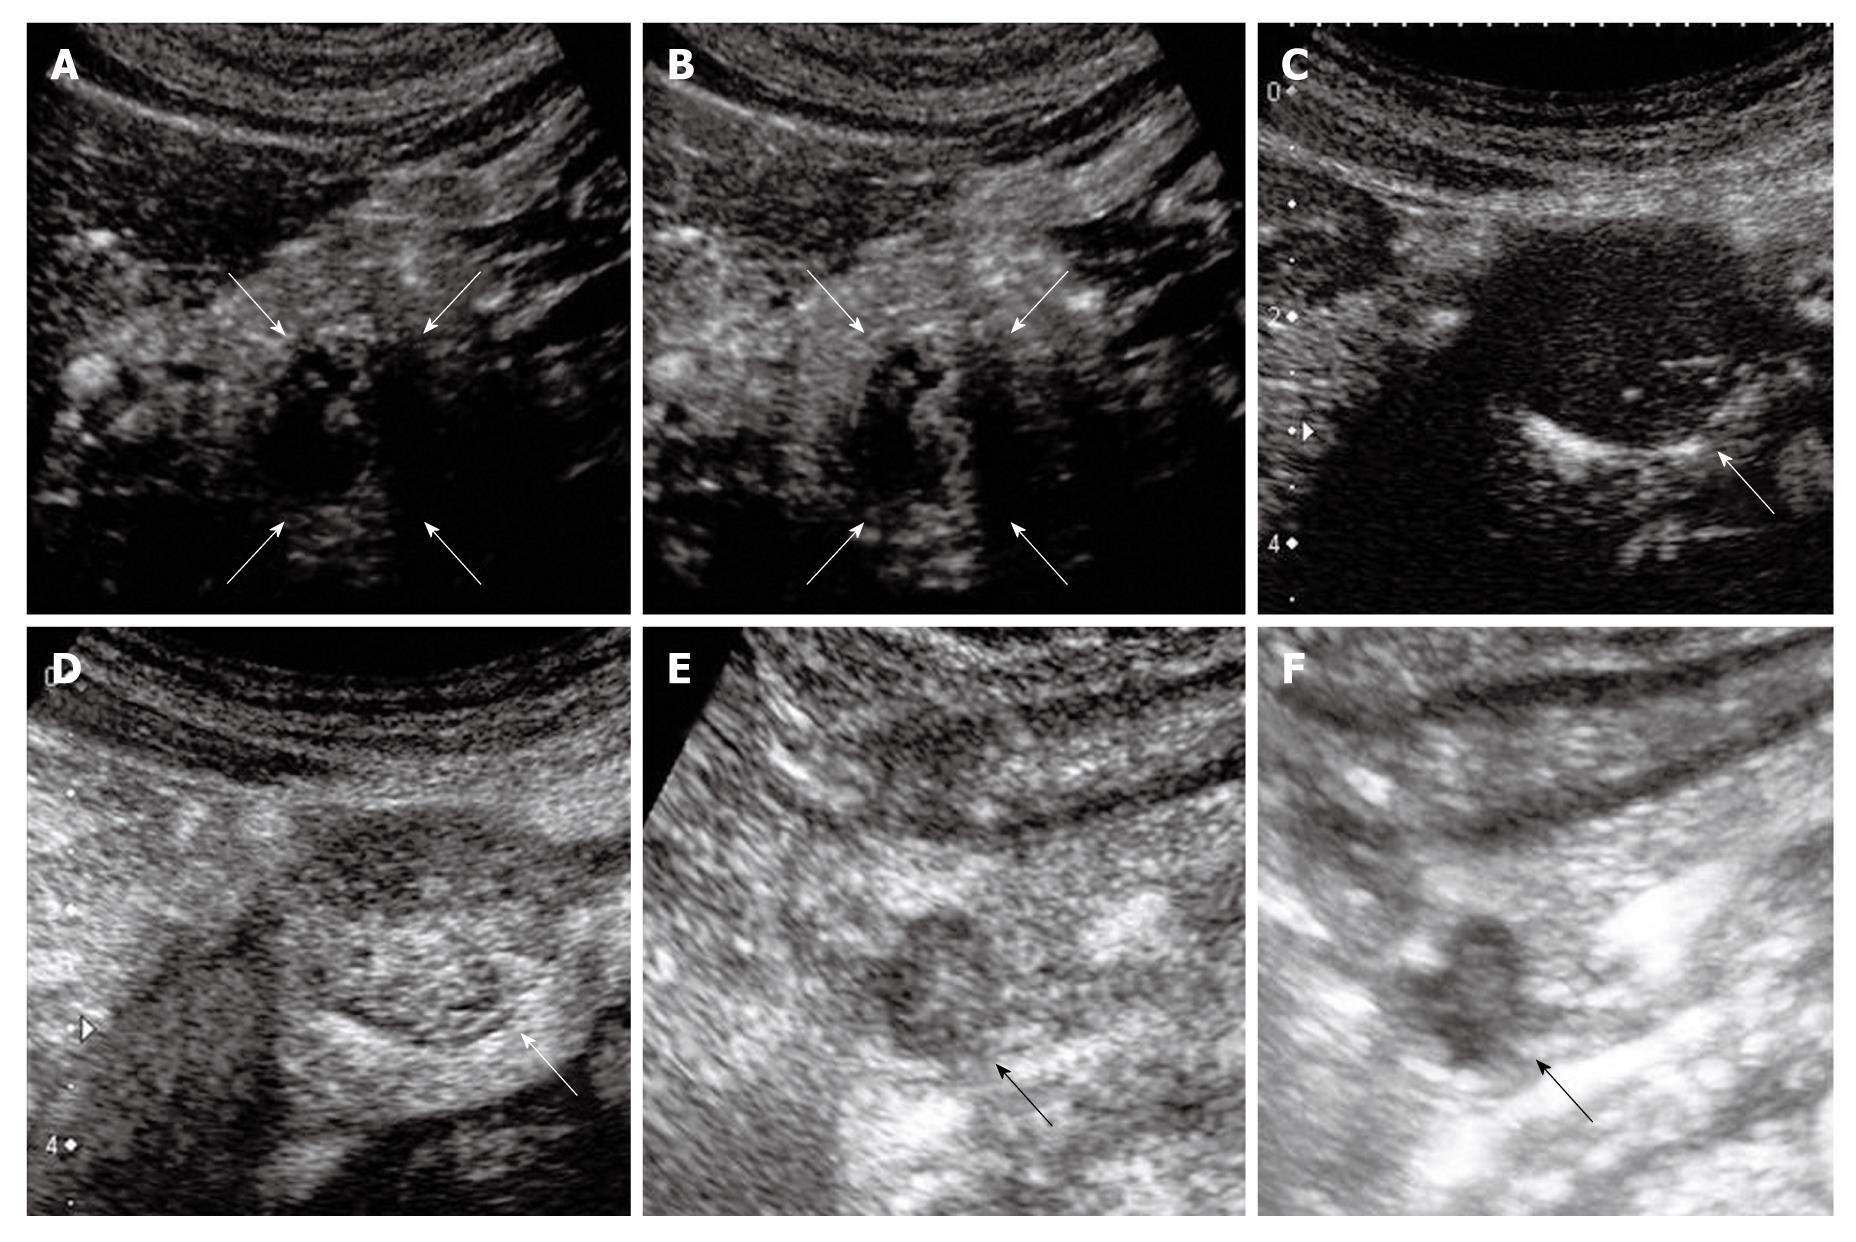
Figure 2 Sonazoid contrast-enhanced ultra sound showed no early enhancement and gradually increasing late phase enhancement.
A: Vascular phase of Case 1; B: Post-vascular phase of Case 1; C: Vascular phase of Case 2; D: Post-vascular phase of Case 2; E: Vascular phase of Case 3; F: Post-vascular phase of Case 3. Tumors are indicated by arrows.
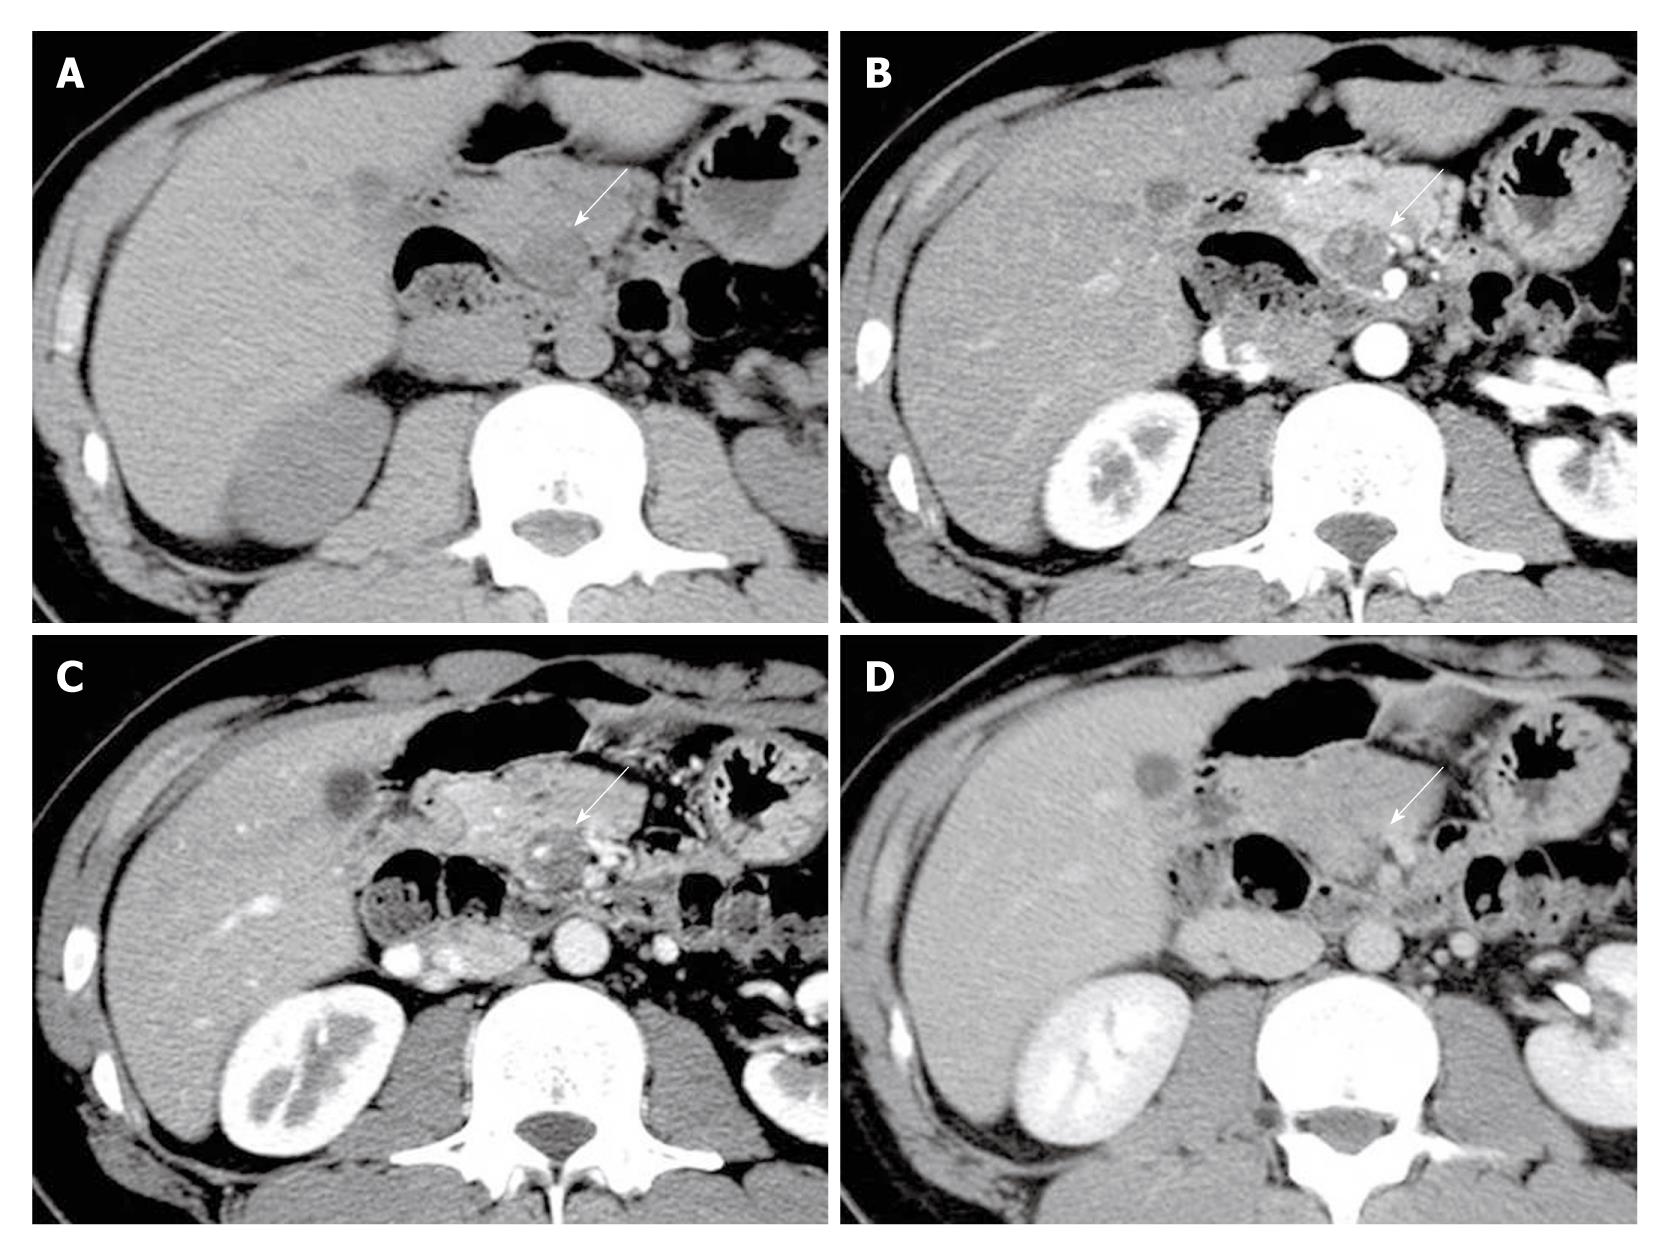
Figure 3 In Case 1, computed tomography indicated a round tumor (arrows) near the head of the pancreas.
Gradually increasing enhancement of the tumor was shown by a dynamic computed tomography study. A: Plain; B: Early phase; C: Portal phase; D: Delayed phase.
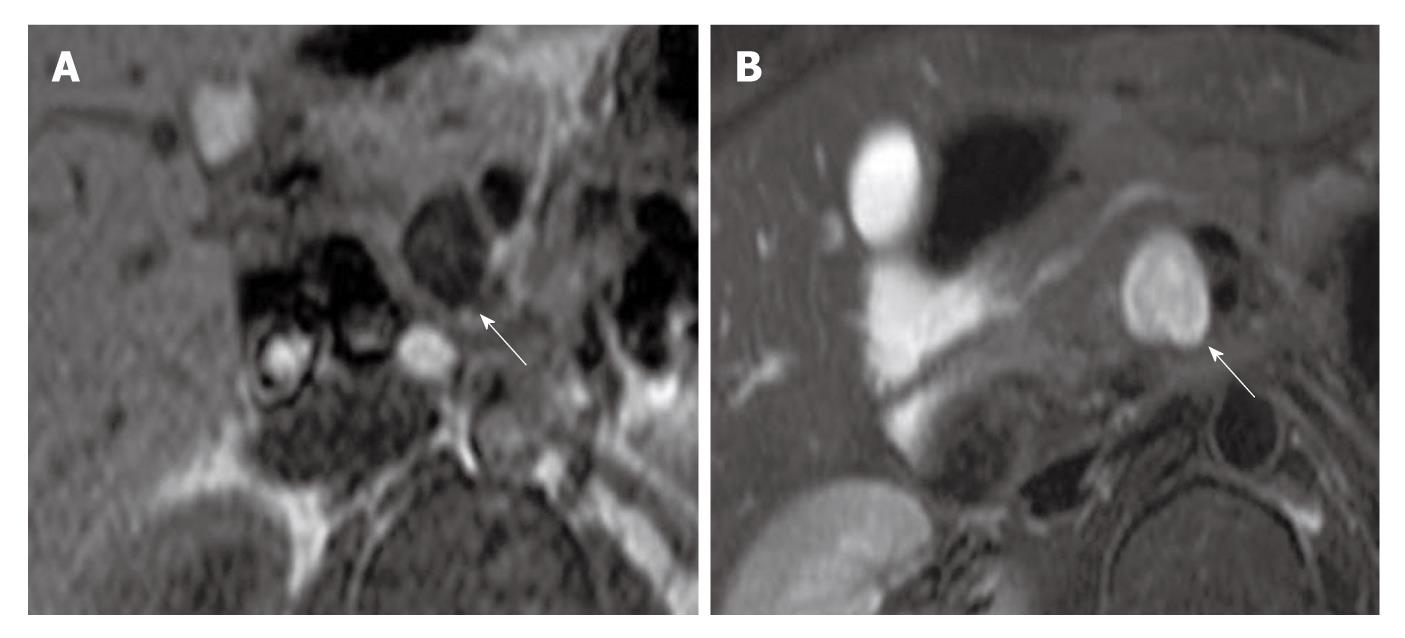
Figure 4 Magnetic resonance imaging of Case 1 showed a round mass (arrows) with low signal intensity in T1-weighted images and high signal intensity in T2-weighted images.
The tumor signal was uniform. A: T1-weighted image; B: T2-weighted image.
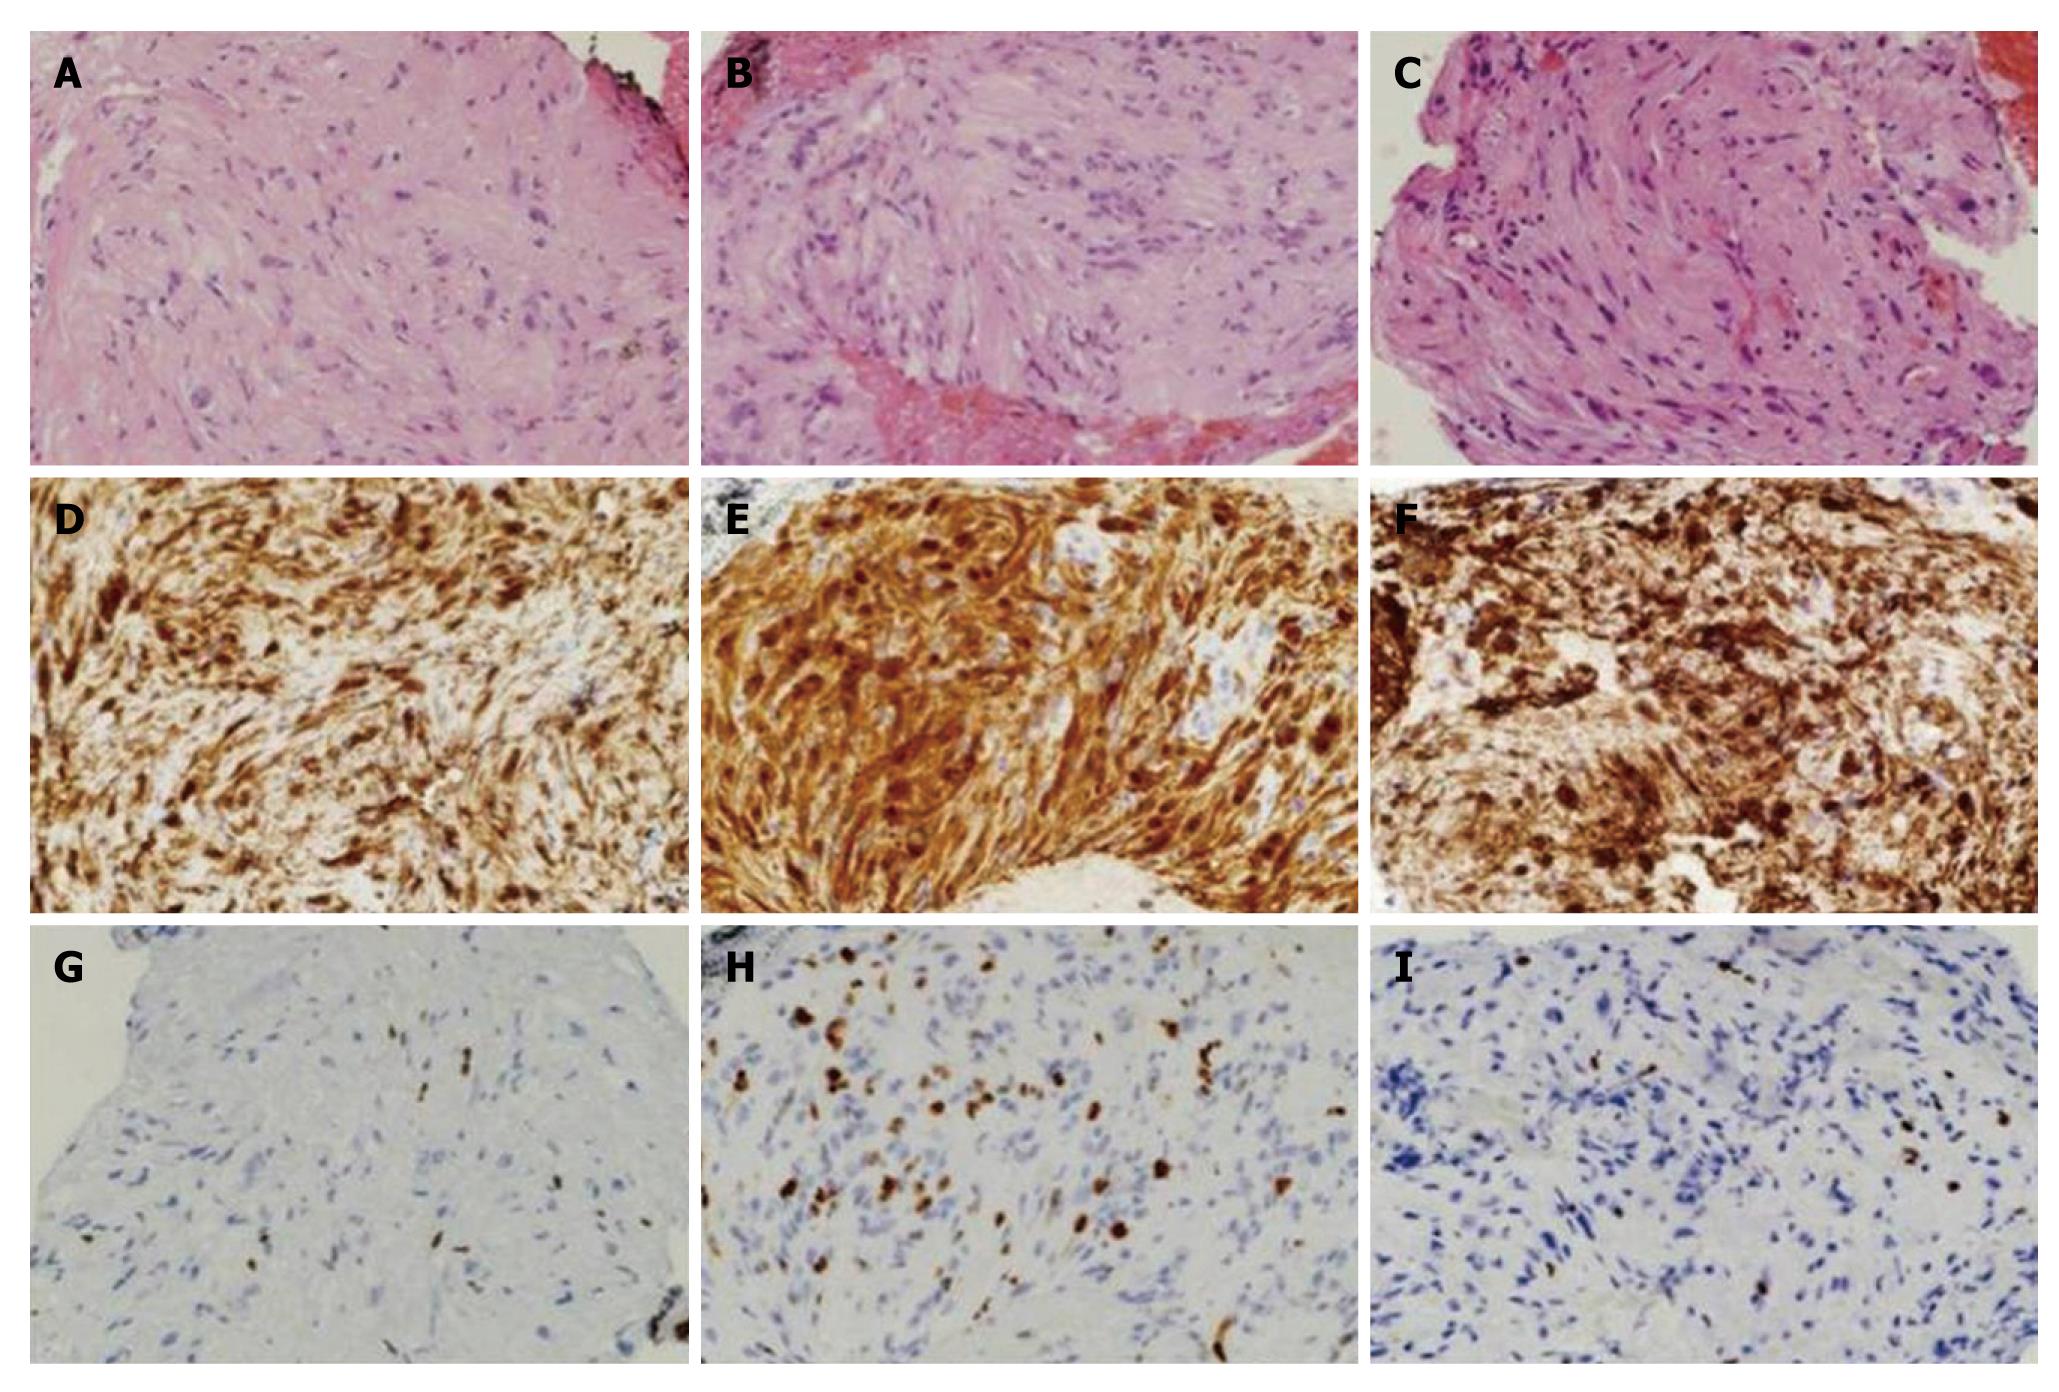
Figure 5 In all three cases the tissue fragments consisted of densely packed, bland spindle cells with nuclear palisading under hematoxylin-eosin staining (× 400).
A: Case 1; B: Case 2; C: Case 3; D-F: S-100 reaction was also positive in all case. D: Case 1; E: Case 2; F: Case 3; G-I: Ki-67 indexes were 3%-15%, 2%-4%, and 3% for Cases 1, 2, and 3, respectively. G: Case 1; H: Case 2; I: Case 3.
- Citation: Kudo T, Kawakami H, Kuwatani M, Ehira N, Yamato H, Eto K, Kubota K, Asaka M. Three cases of retroperitoneal schwannoma diagnosed by EUS-FNA. World J Gastroenterol 2011; 17(29): 3459-3464
- URL: https://www.wjgnet.com/1007-9327/full/v17/i29/3459.htm
- DOI: https://dx.doi.org/10.3748/wjg.v17.i29.3459


