Copyright
©2011 Baishideng Publishing Group Co.
World J Gastroenterol. Jul 28, 2011; 17(28): 3335-3341
Published online Jul 28, 2011. doi: 10.3748/wjg.v17.i28.3335
Published online Jul 28, 2011. doi: 10.3748/wjg.v17.i28.3335
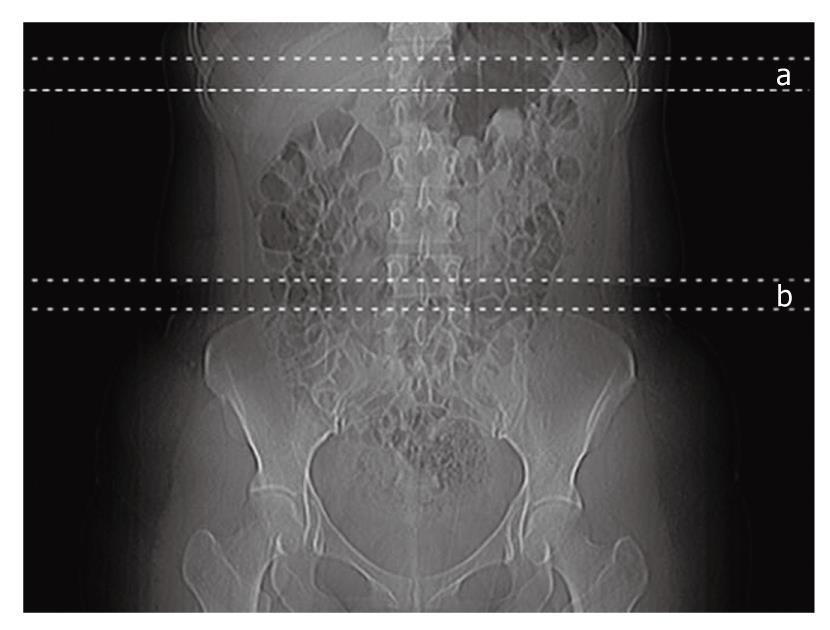
Figure 1 Scanning range of the liver and abdominal fat.
Seven serial axial slices with a thickness of 3 mm were scanned for the liver and the spleen. Another seven slices from the iliac crest and above were scanned to assess abdominal fat. a: The range for hepatic fat examination; b: The range for abdominal fat examination.
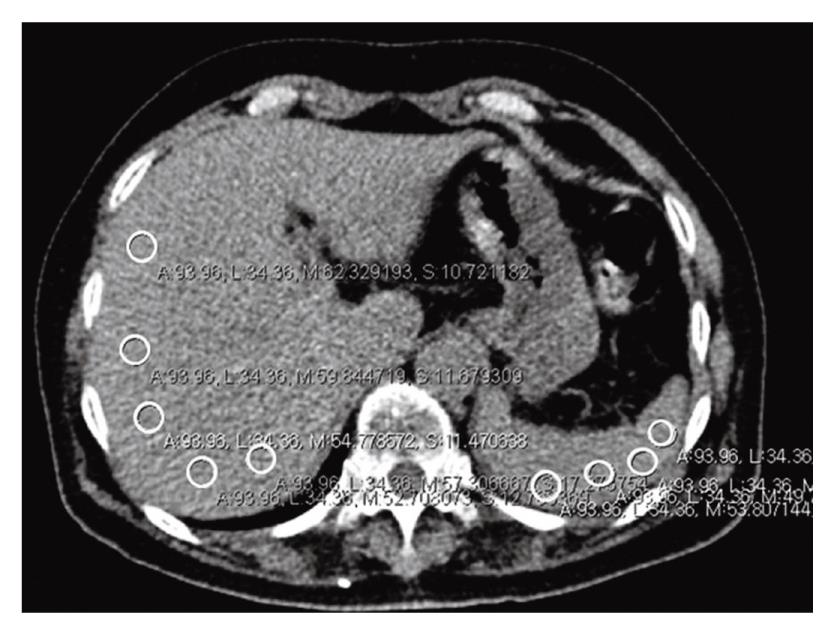
Figure 2 Measurement of attenuation value of the liver and the spleen.
Five regions of interests (ROIs) were placed in the liver avoiding vessels, bile ducts, calcifications, and artifacts. In the spleen, four ROIs were placed in the same manner.
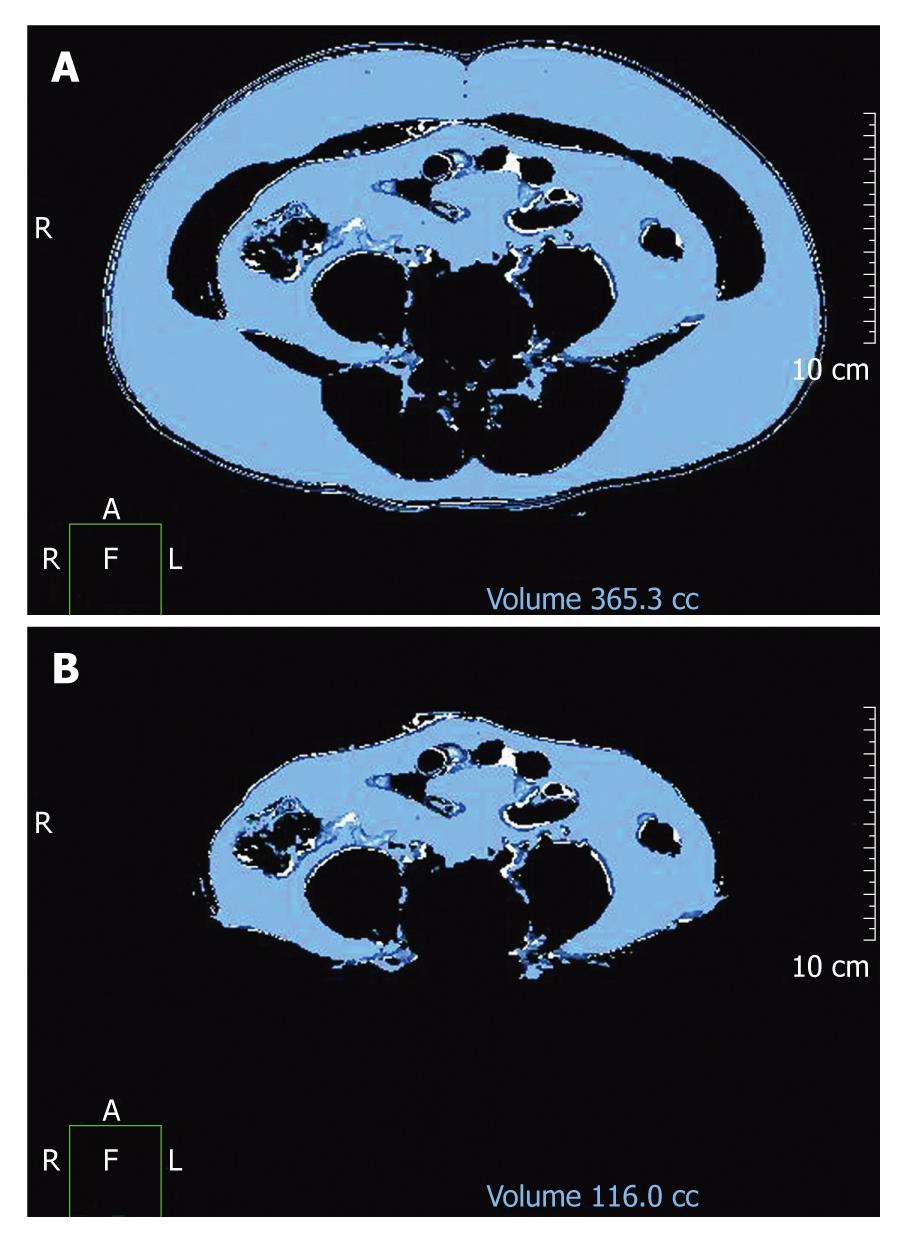
Figure 3 Abdominal fat distribution analysis.
At the level of the umbilicus, abdominal fat volume was automatically calculated using a work station (Philips EBW2 version 3.0). Total abdominal fat volume (A) and visceral fat (VF) volume (B). Subcutaneous fat volume was derived by subtracting VF from total abdominal fat.
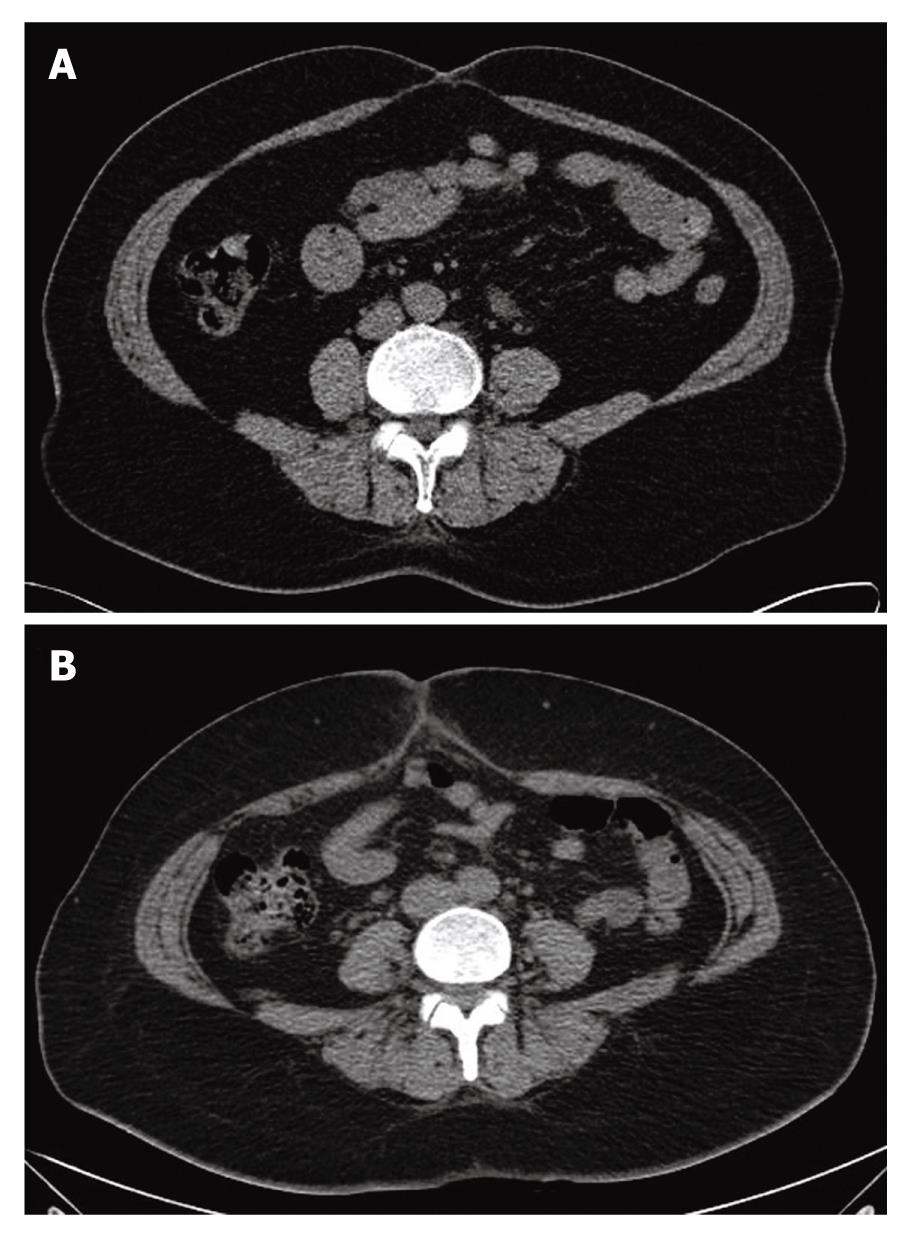
Figure 4 Computed tomography showing cross-sectional abdominal areas at the level of umbilicus in two patients demonstrating variation in fat distribution.
A: Visceral type [49-year-old female; body mass index (BMI), 23.1 kg/m2; visceral fat (VF) area, 146 cm2; subcutaneous fat (SF) area, 115 cm2; the ratio of VF to SF (VS ratio), 1.27]; B: Subcutaneous type (40-year-old female; BMI, 24.0 kg/m2; VF area, 60 cm2; SF area, 190 cm2; VS ratio, 0.31).
- Citation: Jang S, Lee CH, Choi KM, Lee J, Choi JW, Kim KA, Park CM. Correlation of fatty liver and abdominal fat distribution using a simple fat computed tomography protocol. World J Gastroenterol 2011; 17(28): 3335-3341
- URL: https://www.wjgnet.com/1007-9327/full/v17/i28/3335.htm
- DOI: https://dx.doi.org/10.3748/wjg.v17.i28.3335


