Copyright
©2011 Baishideng Publishing Group Co.
World J Gastroenterol. Jul 21, 2011; 17(27): 3257-3262
Published online Jul 21, 2011. doi: 10.3748/wjg.v17.i27.3257
Published online Jul 21, 2011. doi: 10.3748/wjg.v17.i27.3257
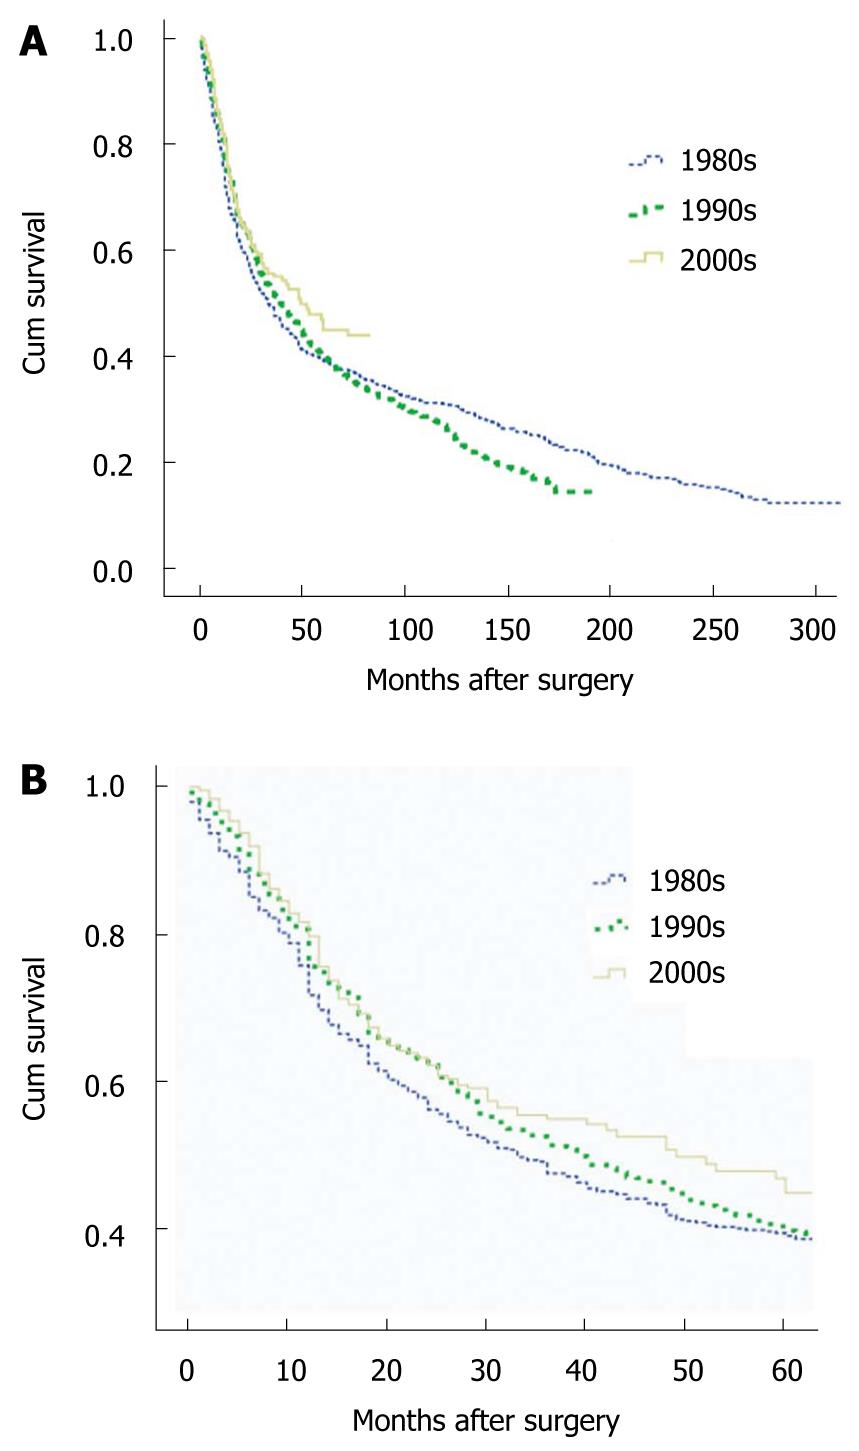
Figure 1 Kaplan-Meier survival curves for patients with gastric cancer by decade.
A: Overall survival for gastric cancer patients; B: Five-year survival for gastric cancer patients.
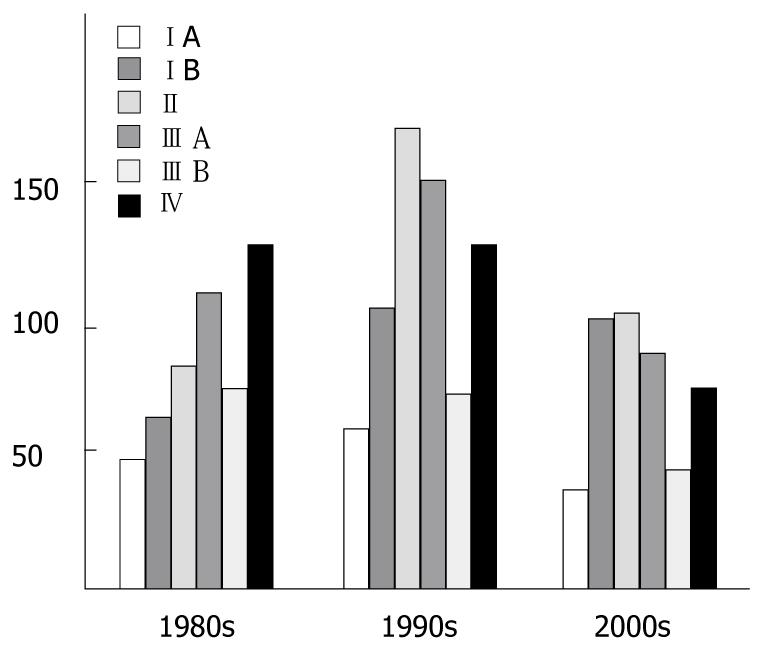
Figure 2 The shift in the distribution of TNM stage of disease at diagnosis.
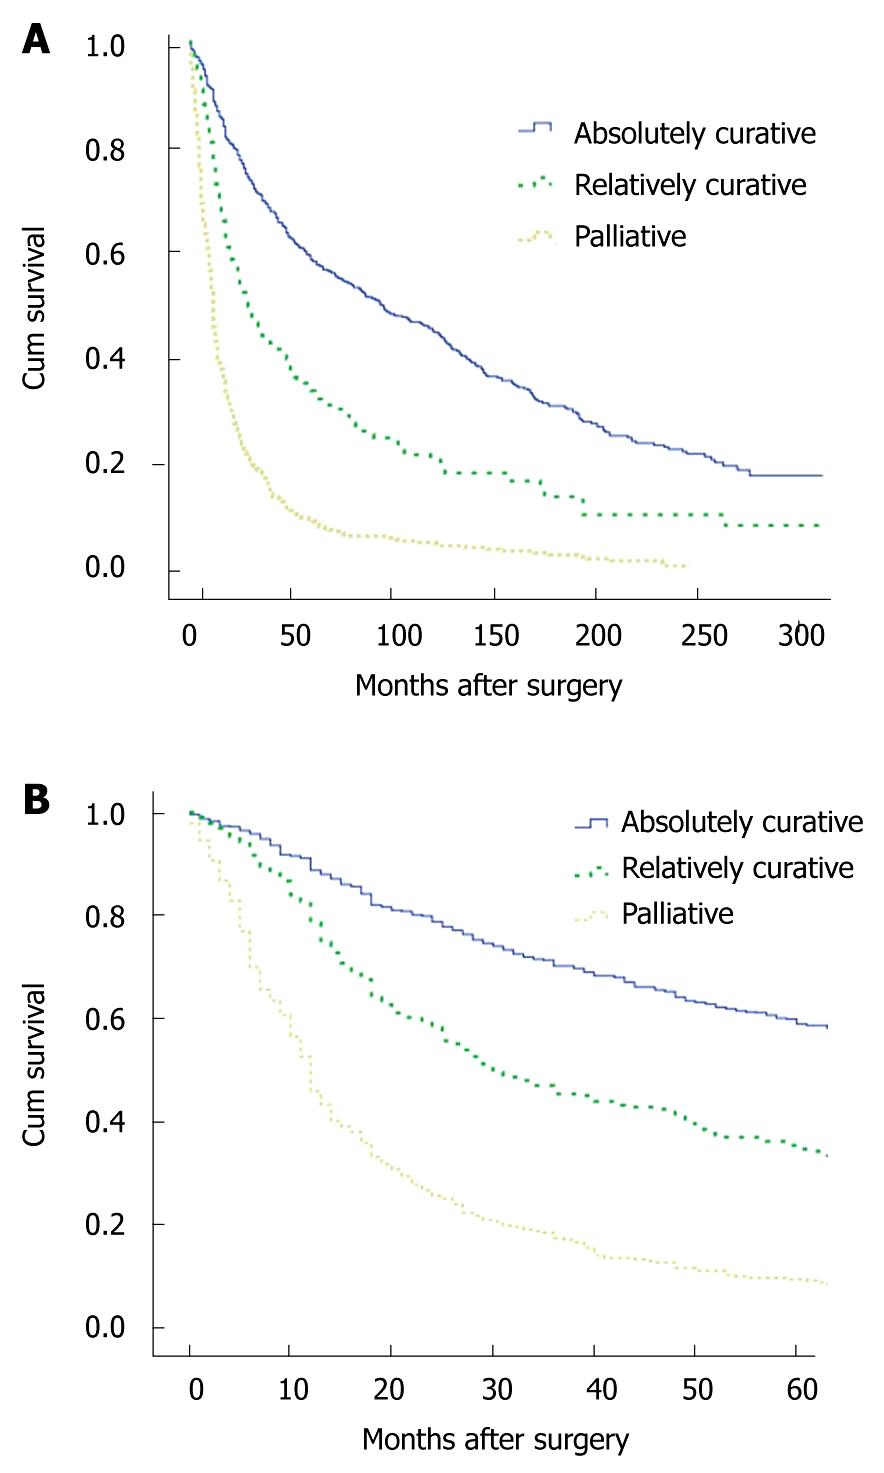
Figure 3 Kaplan-Meier survival curves of patients with gastric cancer, by surgical intervention (absolutely curative, relatively curative, palliative).
A: Overall survival for gastric cancer patients; B: Five-year survival for gastric cancer patients.
- Citation: Zhang H, Sun LL, Meng YL, Song GY, Hu JJ, Lu P, Ji B. Survival trends in gastric cancer patients of Northeast China. World J Gastroenterol 2011; 17(27): 3257-3262
- URL: https://www.wjgnet.com/1007-9327/full/v17/i27/3257.htm
- DOI: https://dx.doi.org/10.3748/wjg.v17.i27.3257


