Copyright
©2011 Baishideng Publishing Group Co.
World J Gastroenterol. May 28, 2011; 17(20): 2563-2571
Published online May 28, 2011. doi: 10.3748/wjg.v17.i20.2563
Published online May 28, 2011. doi: 10.3748/wjg.v17.i20.2563
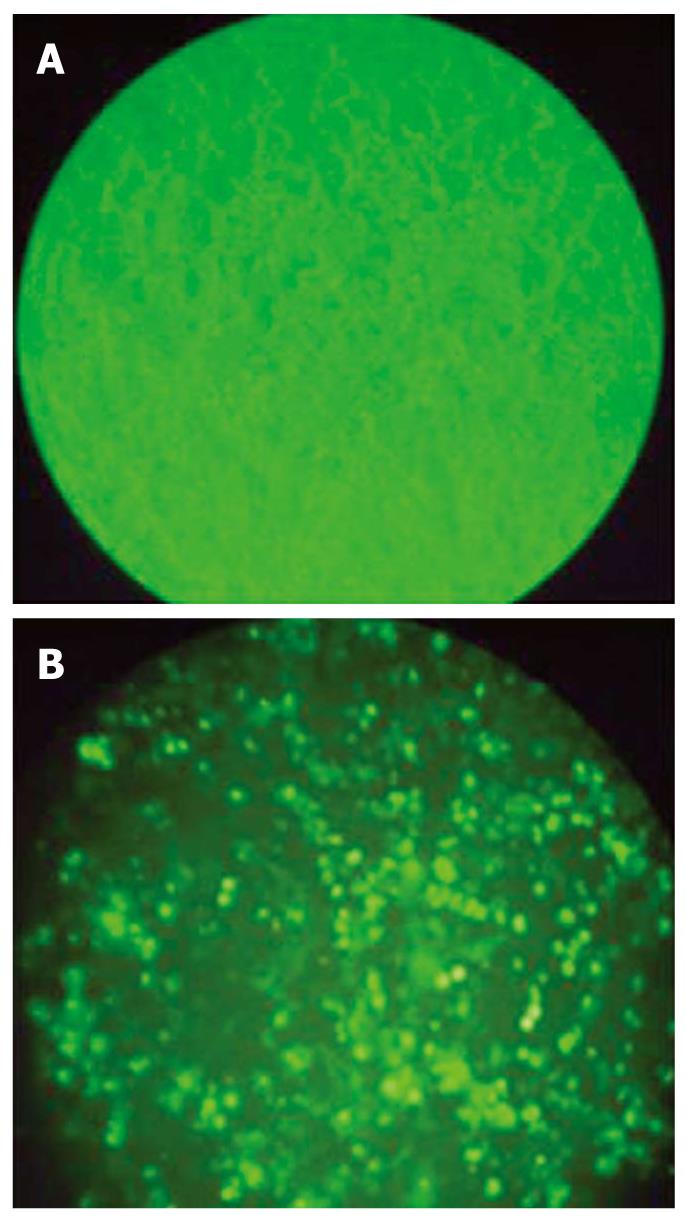
Figure 1 Transfection efficiency.
Successful transfection of small interfering RNA was detected with fluorescence staining in HCT116 cell line. A: HCT116 cell culture; B: HCT116 cell with transfection.
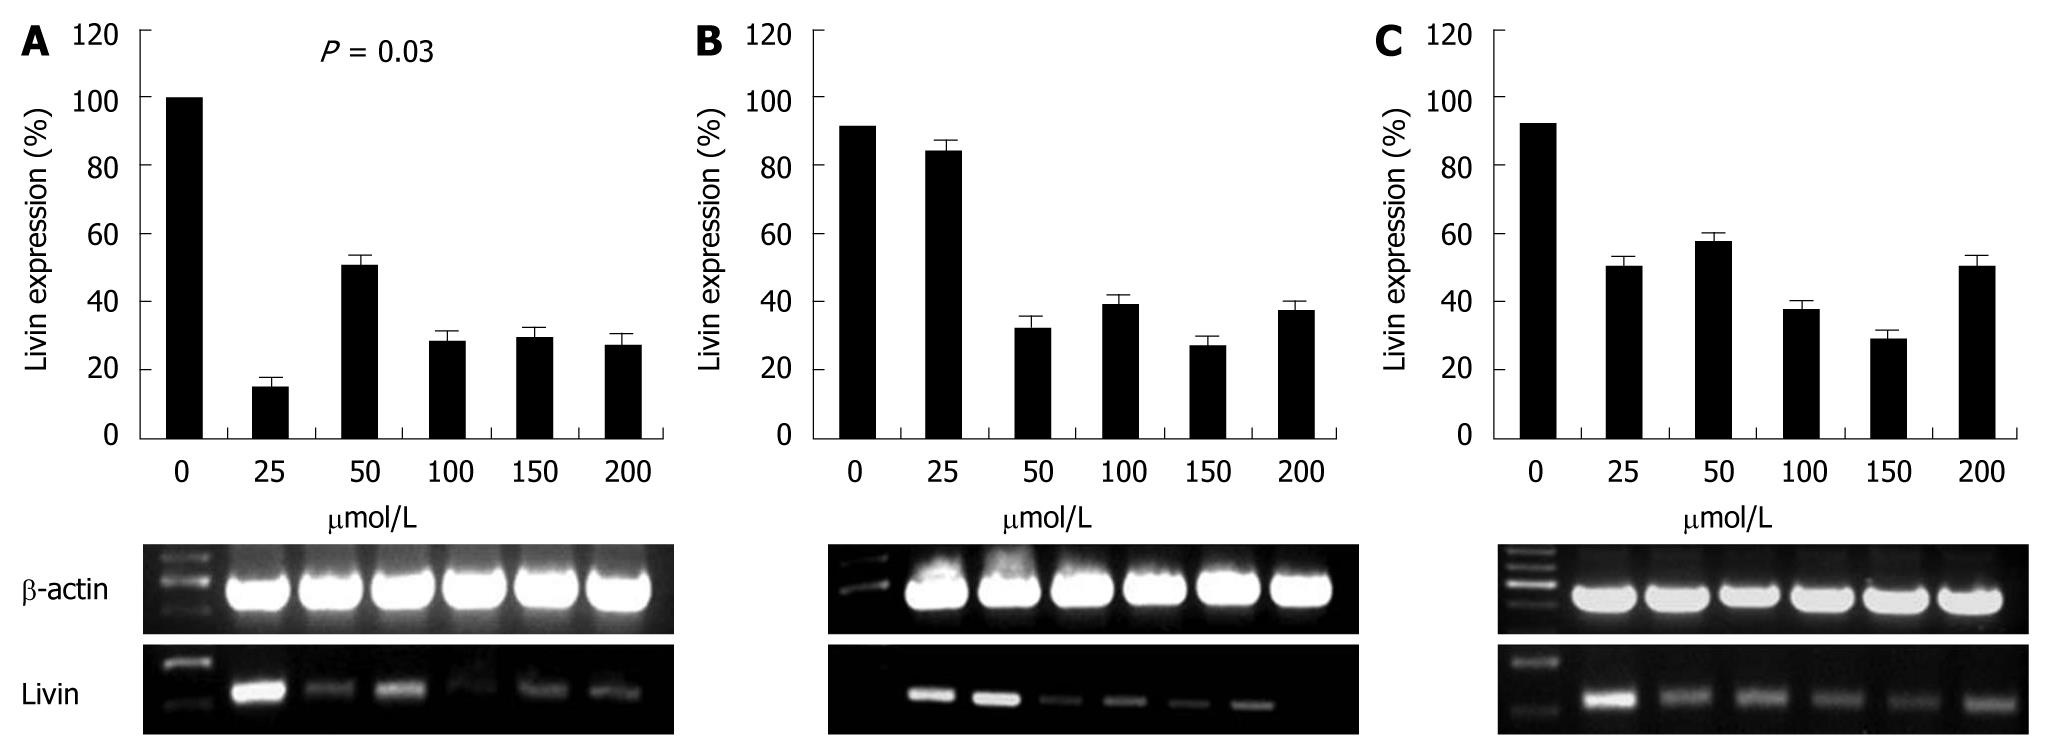
Figure 2 Change of Livin expression after small interfering RNA transfection.
This figure shows Livin expression (%) in HCT116 cells at 18, 24 and 30 h post-transfection with 25, 50, 100, 150 and 200 μmol/L of siRNA. Livin expression was compared with β-actin by Western blotting. A: Livin expression at 18 h post-transfection. It was effectively suppressed by 25 μmol/L of siRNA, but this suppression was not dose-dependent; B: Livin expression at 24 h post-transfection; C: Livin expression at 30 h post-transfection; It was retrieved 30 h after transfection.
Figure 3 Cell counting after small interfering RNA transfection in HCT116 cell line.
We estimated cell count (%) of each groups in HCT116 cells after Livin silencing with 25, 50, 100, 150 and 200 μmol/L of siRNA. The cell count at 18 h after transfection was the most effectively reduced, but this effect was not time-dependent or dose-dependent. A: Cell count at 18 h post-transfection was significantly reduced as compared with control. (P < 0.01); B: Cell count at 24 h post-transfection; C: Cell count at 30 h post-transfection.
Figure 4 MTT assay after small interfering RNA transfection in HCT116 cell line.
A: The proliferation of cells transfected with siRNA was remarkably inhibited at 18 h post-transfection (P = 0.04); B and C: Cellular proliferation at 24 and 30 h post-transfection. The inhibitory effect shown A disappeared, cellular proliferation was similar with control.
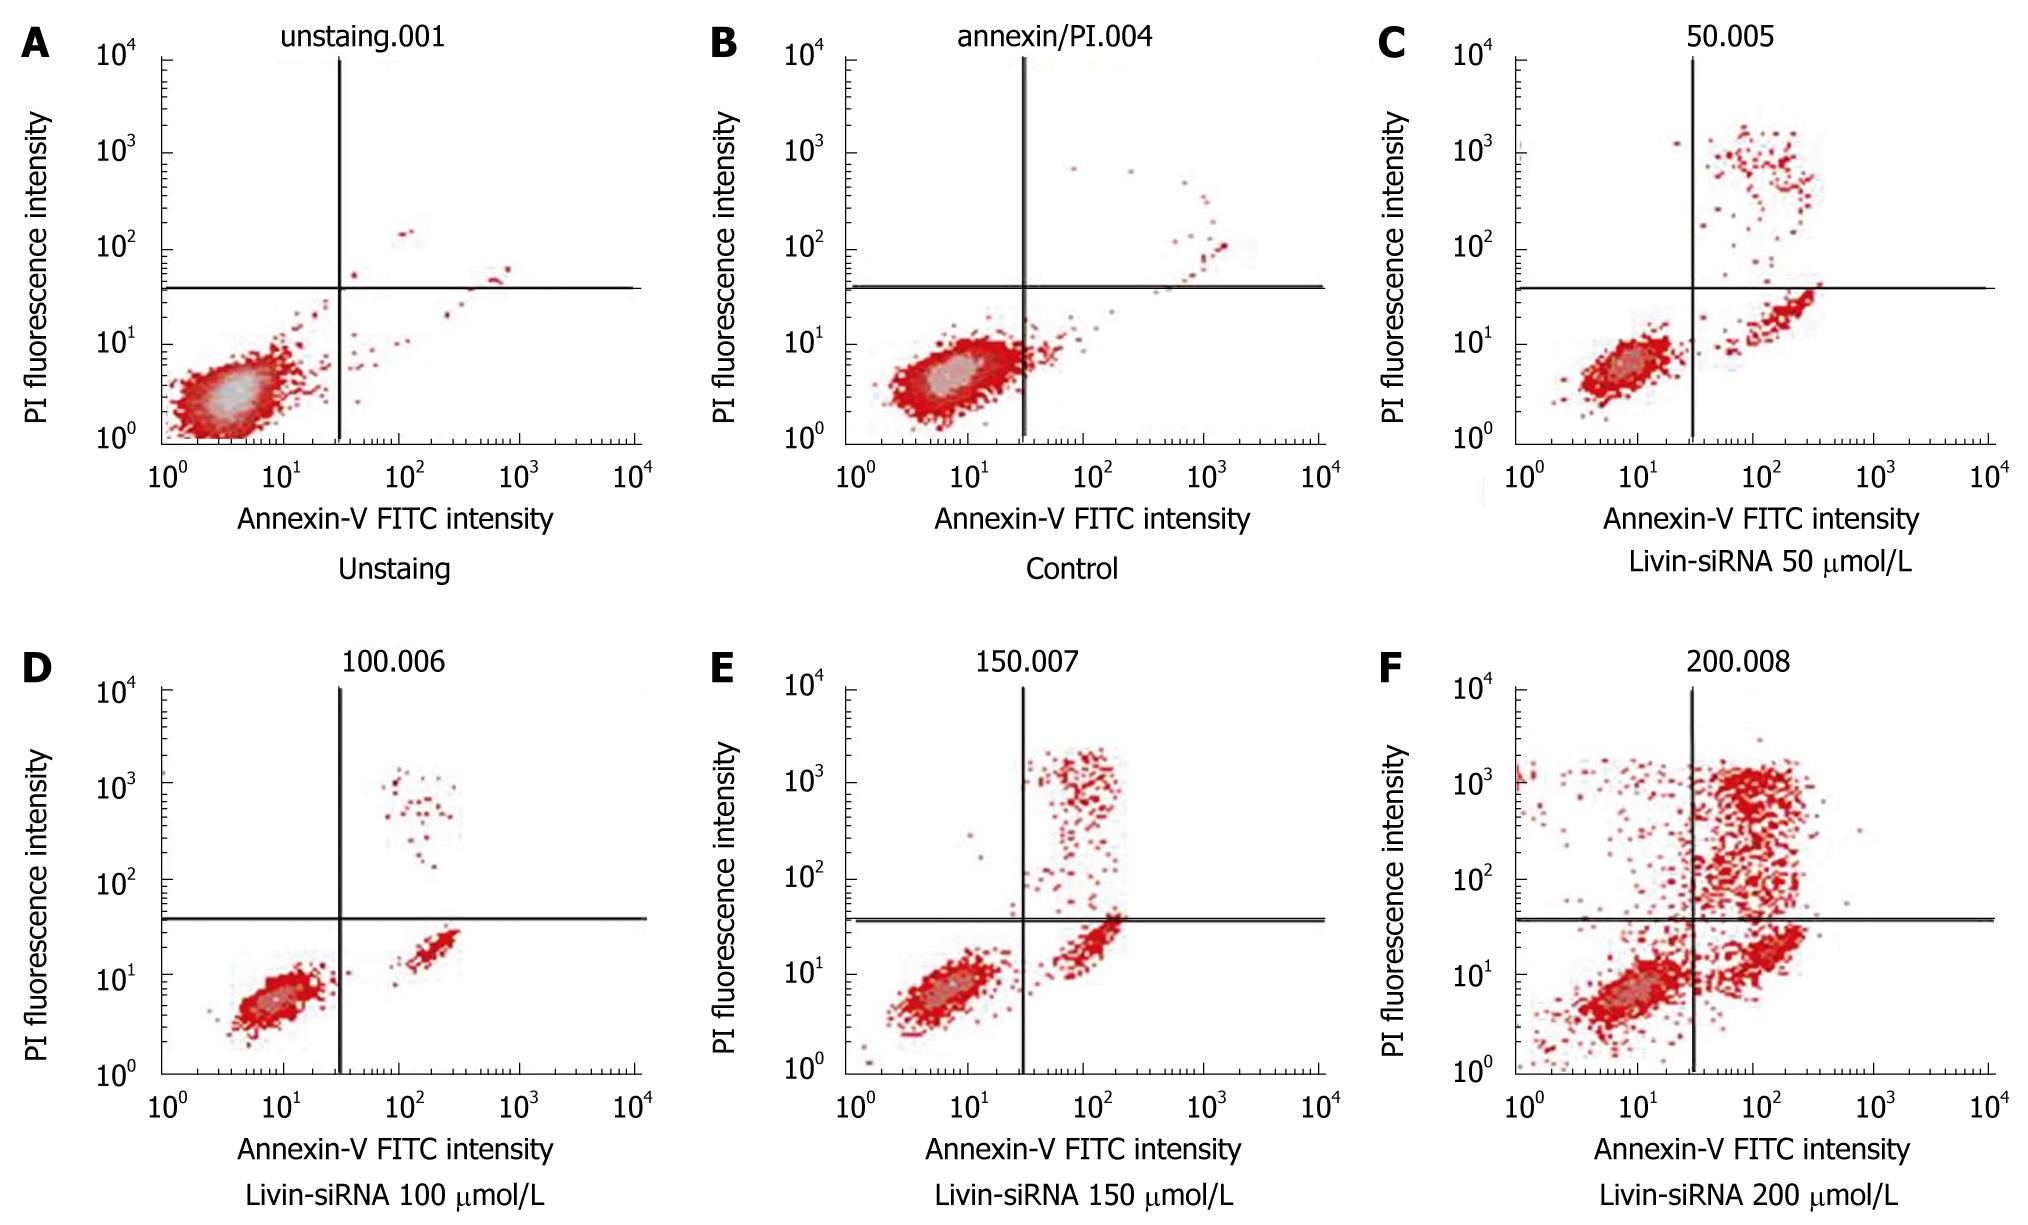
Figure 5 Results of Annexin V staining after small interfering RNA transfection in HCT116 cell line.
The apoptotic portion (right lower quadrant) was increased continuously after siRNA transfection, but the necrotic portion (right upper quadrant) was also increased. A: The apoptotic rate of staining was 0.26%; B: The apoptotic rate of control was 3.91%; C: The apoptotic rate of cells transfected with siRNA 50 μmol/L was 30.32%; D: The apoptotic rate of cells transfected with siRNA 100 μmol/L was 32.88%; E: The apoptotic rate of cells transfected with siRNA 150 μmol/L was 36.91%; F: The apoptotic rate of cells transfected with siRNA 200 μmol/L was 45.08%.
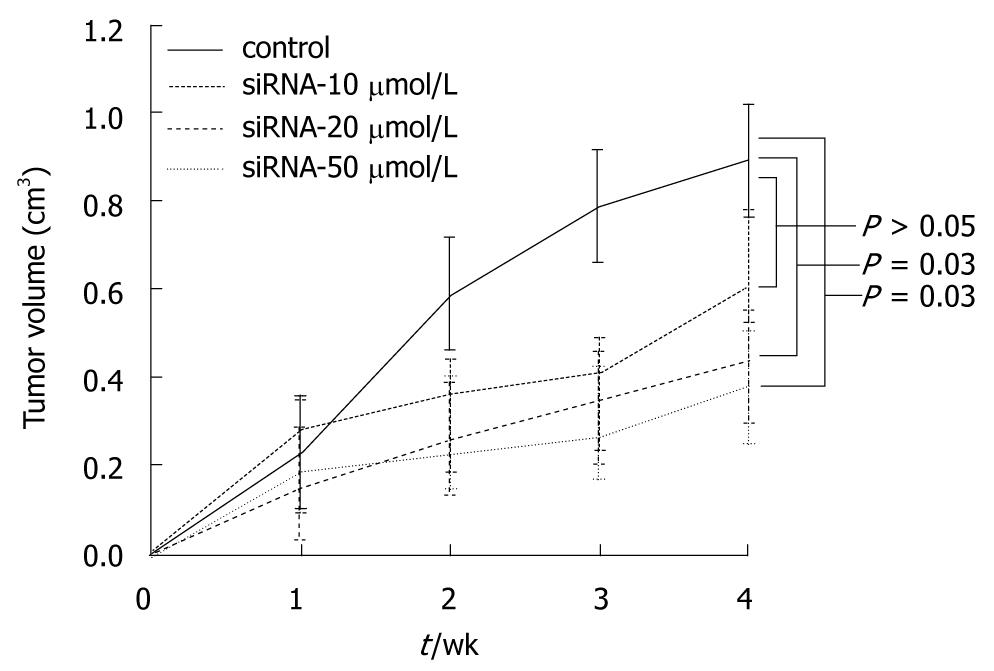
Figure 6 Tumor volume after small interfering RNA intratumoral injection in vivo.
The inoculated mice were divided into four groups and were treated with different doses of siRNA (10, 20 and 50 μmol/L) weekly for 4 wk; tumor volumes were checked every week. In higher than 20 μmol/L siRNA, the tumor volumes were significantly decreased as compared with control group from 2 wk after transfection (P = 0.03).
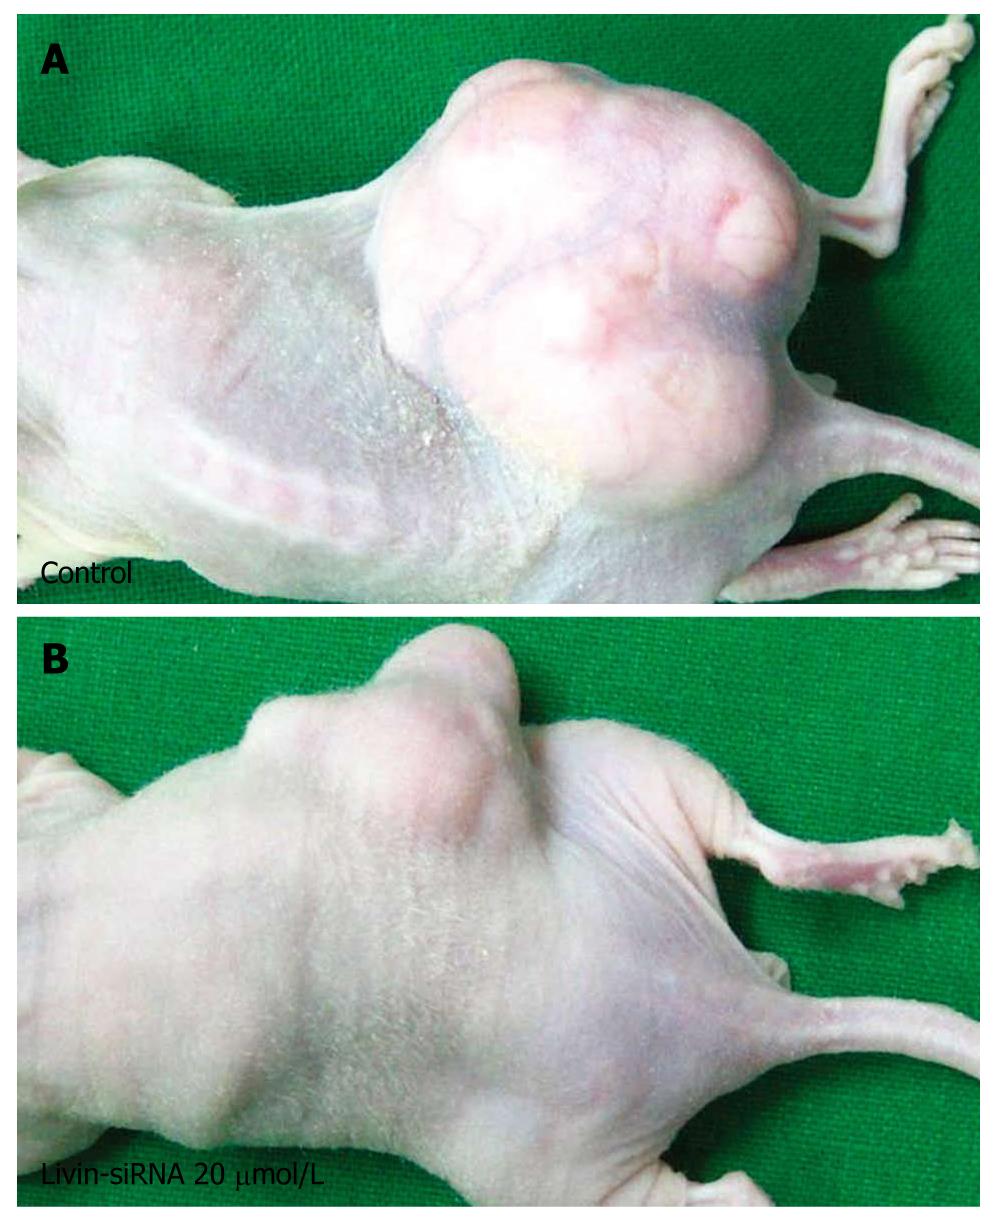
Figure 7 Tumor xenograft in nude mice.
The inoculated mice were divided into two groups (control and siRNA-20 μmol/L treated group), and then tumor volume was measured in the the same manner as described in Figure 6. A: Control group; B: siRNA-20 μmol/L treated group. The tumor volume was dramatically decreased as compared with control.
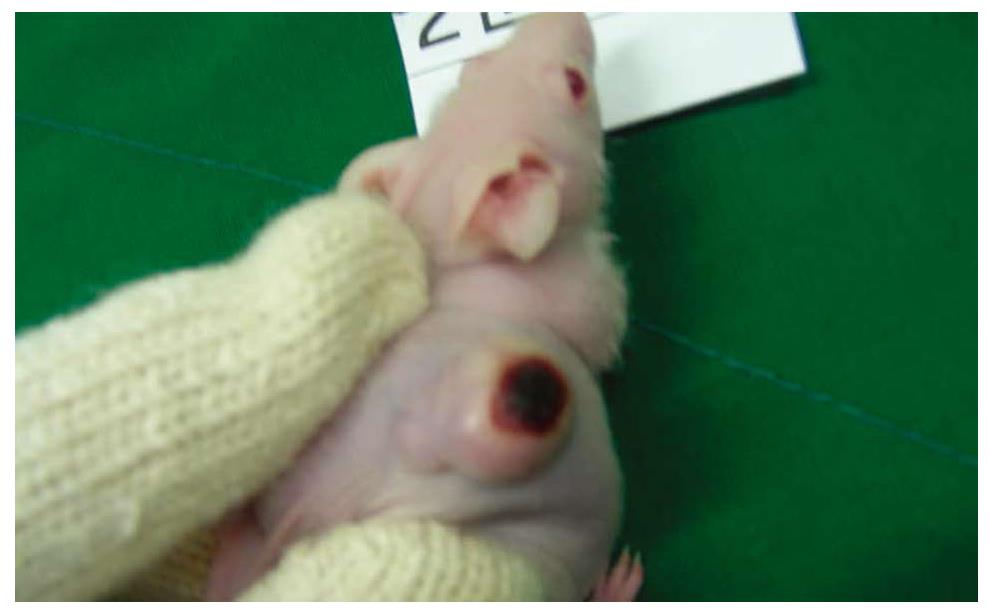
Figure 8 Hemorrhagic necrosis in small interfering RNA injection site.
The inoculated mice were injected with siRNA via the intratumoral route; there was local hemorrhagic necrosis in the direct injection site of siRNA.
- Citation: Oh BY, Lee RA, Kim KH. siRNA targeting Livin decreases tumor in a xenograft model for colon cancer. World J Gastroenterol 2011; 17(20): 2563-2571
- URL: https://www.wjgnet.com/1007-9327/full/v17/i20/2563.htm
- DOI: https://dx.doi.org/10.3748/wjg.v17.i20.2563


