Copyright
©2011 Baishideng Publishing Group Co.
World J Gastroenterol. Apr 14, 2011; 17(14): 1874-1878
Published online Apr 14, 2011. doi: 10.3748/wjg.v17.i14.1874
Published online Apr 14, 2011. doi: 10.3748/wjg.v17.i14.1874
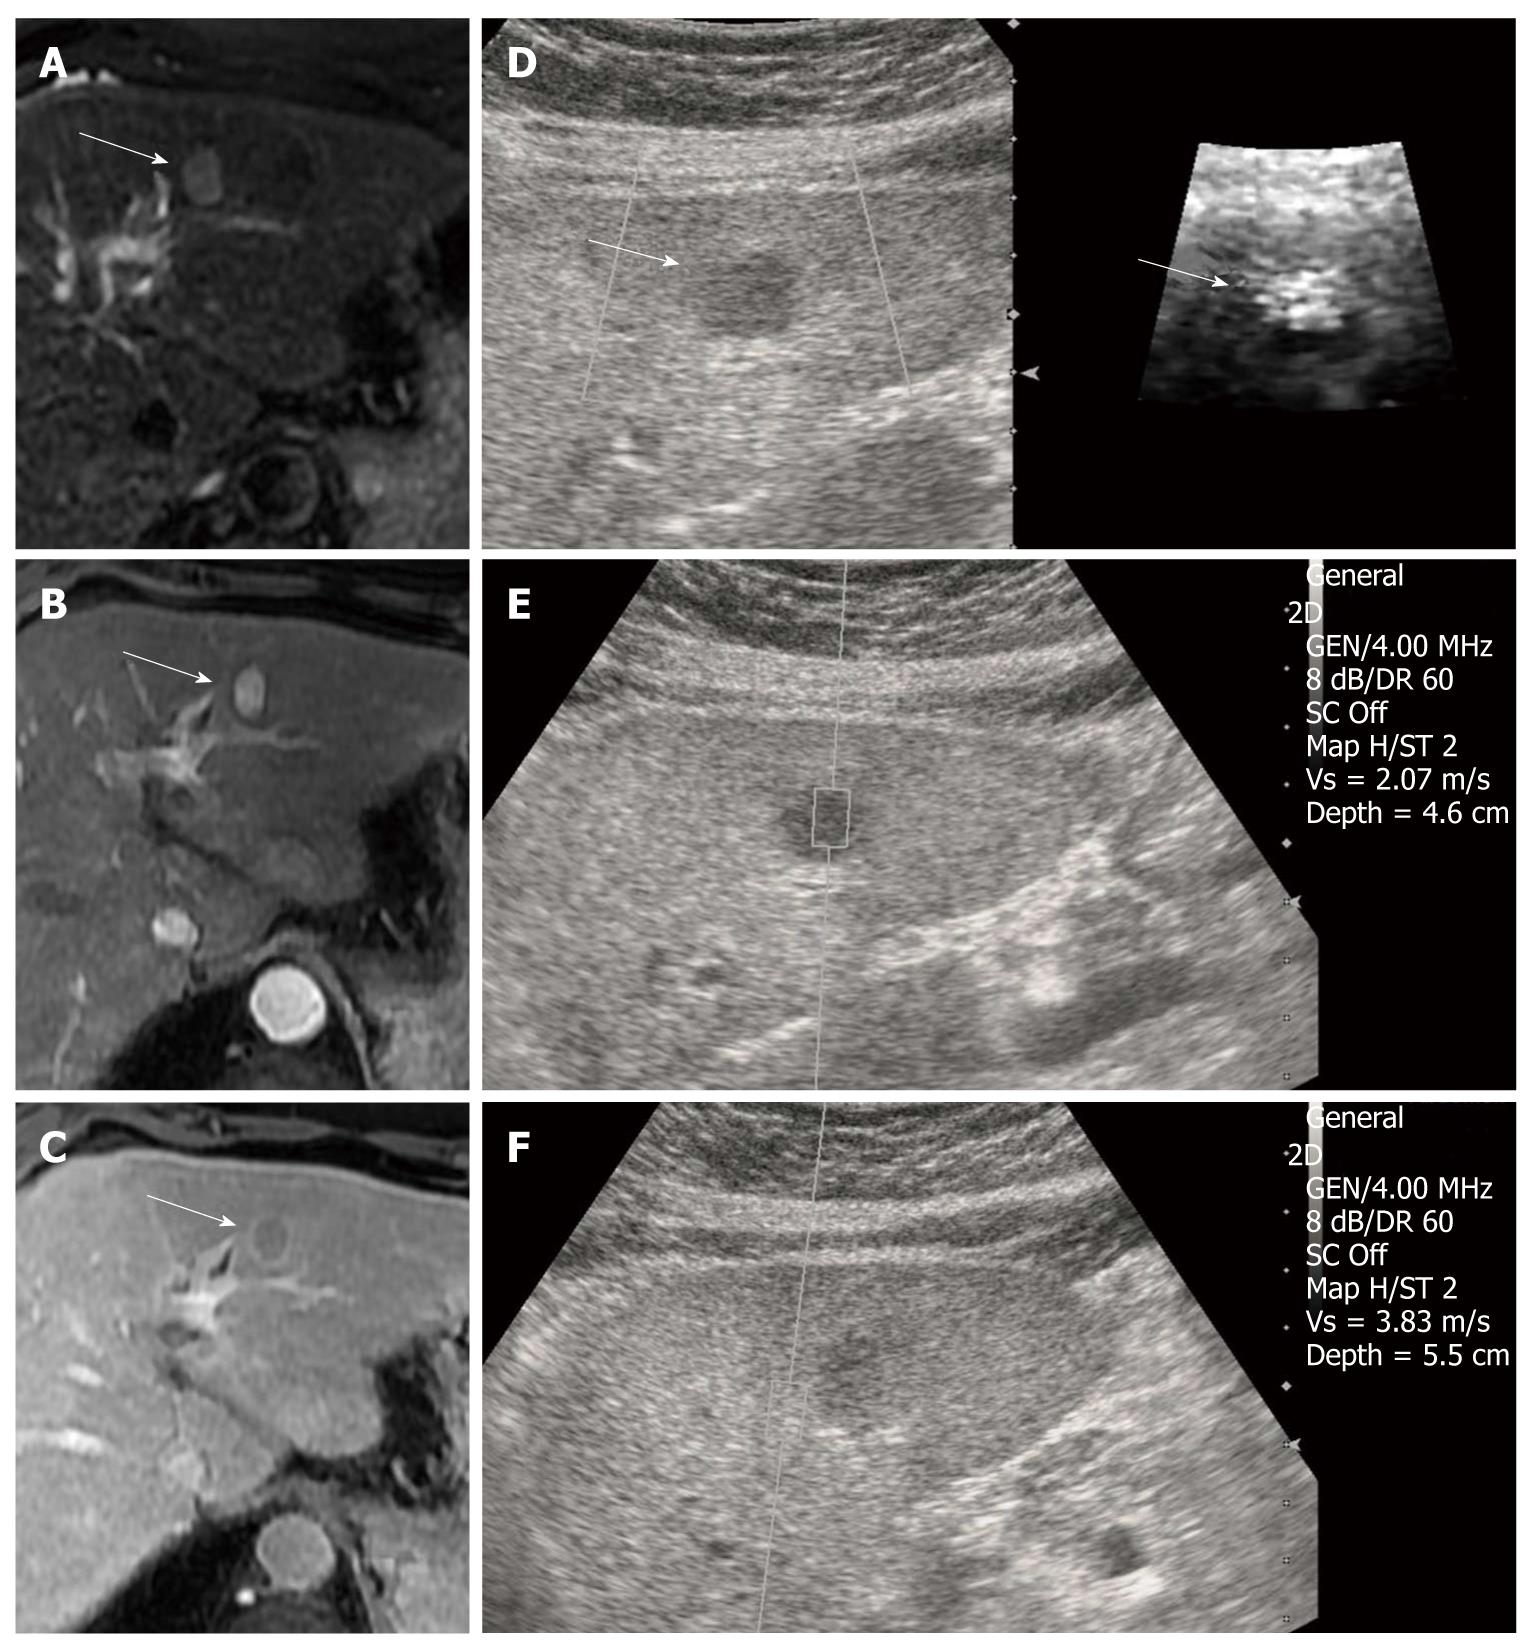
Figure 1 Hepatocellular carcinoma in a 59-year-old man with underlying liver cirrhosis.
A: T2-weighted magnetic resonance (MR) image shows a high signal intensity mass in segment 2 of the liver (arrow); B: On dynamic study, the mass revealed an arterial enhancement; C: Delayed wash-out, which is a typical finding of hepatocellular carcinoma (HCC) (arrow); D: On B-mode image, the HCC appears as a well defined, hypoechoic mass and the HCC have a bright (softer) color on the acoustic radiation force impulse (ARFI) image (arrows); E: The shear wave velocity (SWV) of HCC is 2.07 m/s; F: SWV of surrounding cirrhotic hepatic parenchyma measures 3.83 m/s. GEN: General; SC: Spatial compounding; Vs: Velocity.
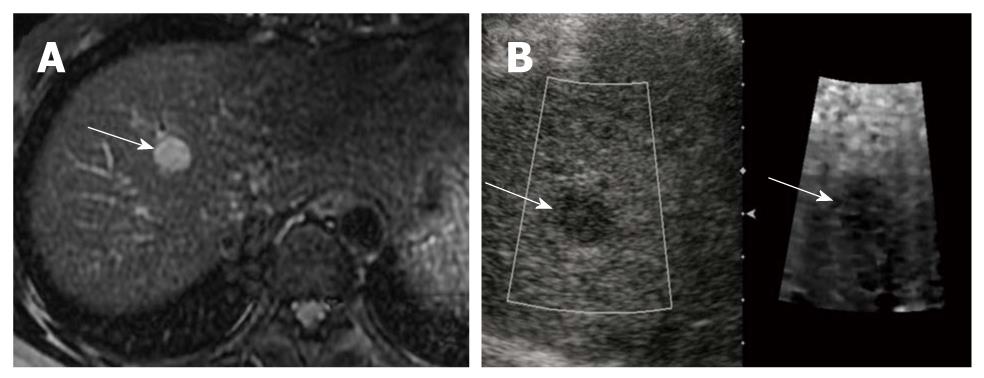
Figure 2 Hepatocellular carcinoma in a 45-year-old woman with underlying liver cirrhosis.
A: T2-weighted magnetic resonance image shows a high signal intensity hepatocellular carcinoma (HCC) in segment 4 of the liver (arrow); B: On a B-mode image, the HCC is seen as an ovoid, hypoechoic mass (arrow), that appears darker (stiffer) than hepatic background on the acoustic radiation force impulse image (arrow). The shear wave velocity of HCC and surrounding hepatic parenchyma were measured as 2.20 m/s and 1.57 m/s, respectively (not shown).
Figure 3 Post-radiofrequency ablation hepatocellular carcinoma in a 71-year-old woman with underlying liver cirrhosis.
A: Contrast-enhanced arterial phase computed tomography scan obtained immediately after radiofrequency ablation (RFA) shows the ablation zone of low attenuation (asterisk) with a surrounding ring of benign enhancement (arrows) in segment 5 of the liver; B: Next day, follow up B-mode image of post-RFA hepatocellular carcinoma (HCC) is seen as an ill-defined heterogeneous echogenic lesion (arrow) and the HCC appears darker on the acoustic radiation force impulse image (asterisk); C: The shear wave velocity of post-RFA HCC is uncheckable, shown as X.XX m/s. GEN: General; SC: Spatial compounding; Vs: Velocity.
Figure 4 Recurred hepatocellular carcinoma after radiofrequency ablation in a 65-year-old man with underlying liver cirrhosis.
A: Follow-up post-radiofrequency ablation (RFA) computed tomography (CT) scan shows the ablation zone of low attenuation without residual or recurrent tumor in segment 5 of the liver (arrow); B: Contrast-enhanced CT scan obtained after 6 mo shows enhancing nodule in the ablated lesion (asterisk). The serum alpha-fetoprotein increased from 2.6 ng/mL to 16.8 ng/mL; C: On a B-mode image, prior RFA site and recurred hepatocellular carcinoma (HCC) are seen as homogeneous hyperechoic lesions and subtle heterogeneous echogenic nodules with a thin hypoechoic rim (arrows). The recurred HCC appears as a brighter color (softer) with a distinct border on the acoustic radiation force impulse image.
- Citation: Kwon HJ, Kang MJ, Cho JH, Oh JY, Nam KJ, Han SY, Lee SW. Acoustic radiation force impulse elastography for hepatocellular carcinoma-associated radiofrequency ablation. World J Gastroenterol 2011; 17(14): 1874-1878
- URL: https://www.wjgnet.com/1007-9327/full/v17/i14/1874.htm
- DOI: https://dx.doi.org/10.3748/wjg.v17.i14.1874


