Copyright
copy;2010 Baishideng Publishing Group Co.
World J Gastroenterol. Sep 28, 2010; 16(36): 4564-4569
Published online Sep 28, 2010. doi: 10.3748/wjg.v16.i36.4564
Published online Sep 28, 2010. doi: 10.3748/wjg.v16.i36.4564
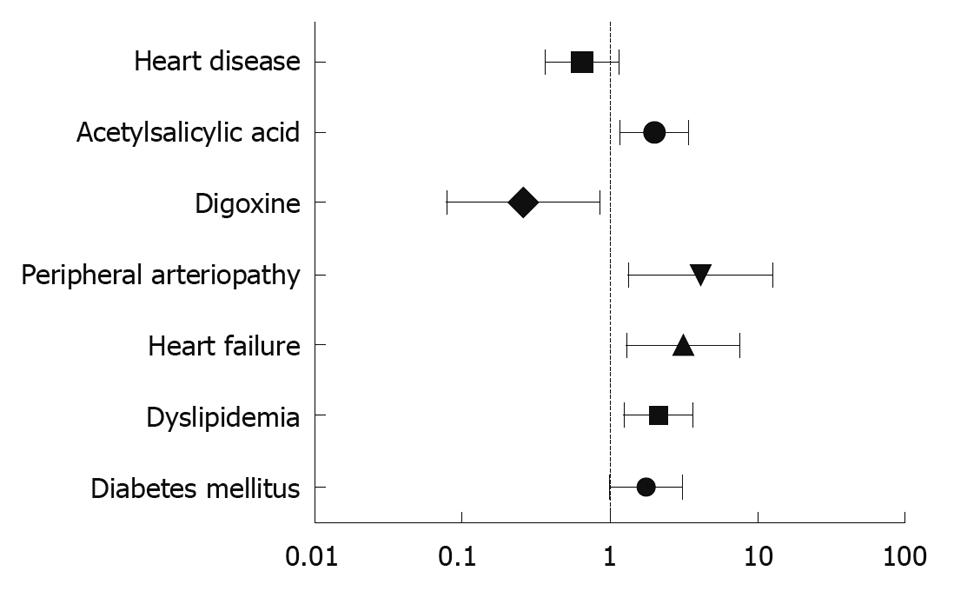
Figure 1 Odds ratio graph.
Odds ratio and 95% confidence interval of variables included in model B.
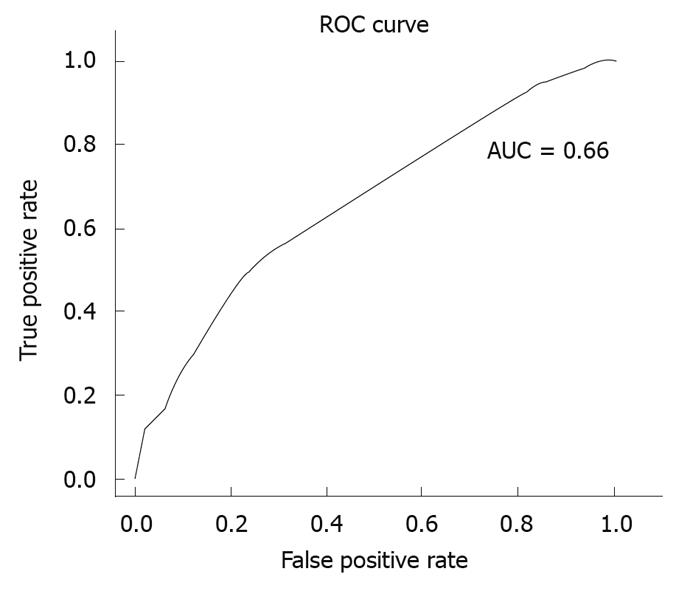
Figure 2 Receiver operator characteristic curve.
Receiver operator characteristic (ROC) curves and area under the curve (AUC) of the model developed in the case-control study.
- Citation: Fernández JC, Calvo LN, Vázquez EG, García MJG, Pérez MTA, Silva IM, Seara JF. Risk factors associated with the development of ischemic colitis. World J Gastroenterol 2010; 16(36): 4564-4569
- URL: https://www.wjgnet.com/1007-9327/full/v16/i36/4564.htm
- DOI: https://dx.doi.org/10.3748/wjg.v16.i36.4564


