Copyright
©2010 Baishideng.
World J Gastroenterol. Jul 21, 2010; 16(27): 3394-3401
Published online Jul 21, 2010. doi: 10.3748/wjg.v16.i27.3394
Published online Jul 21, 2010. doi: 10.3748/wjg.v16.i27.3394
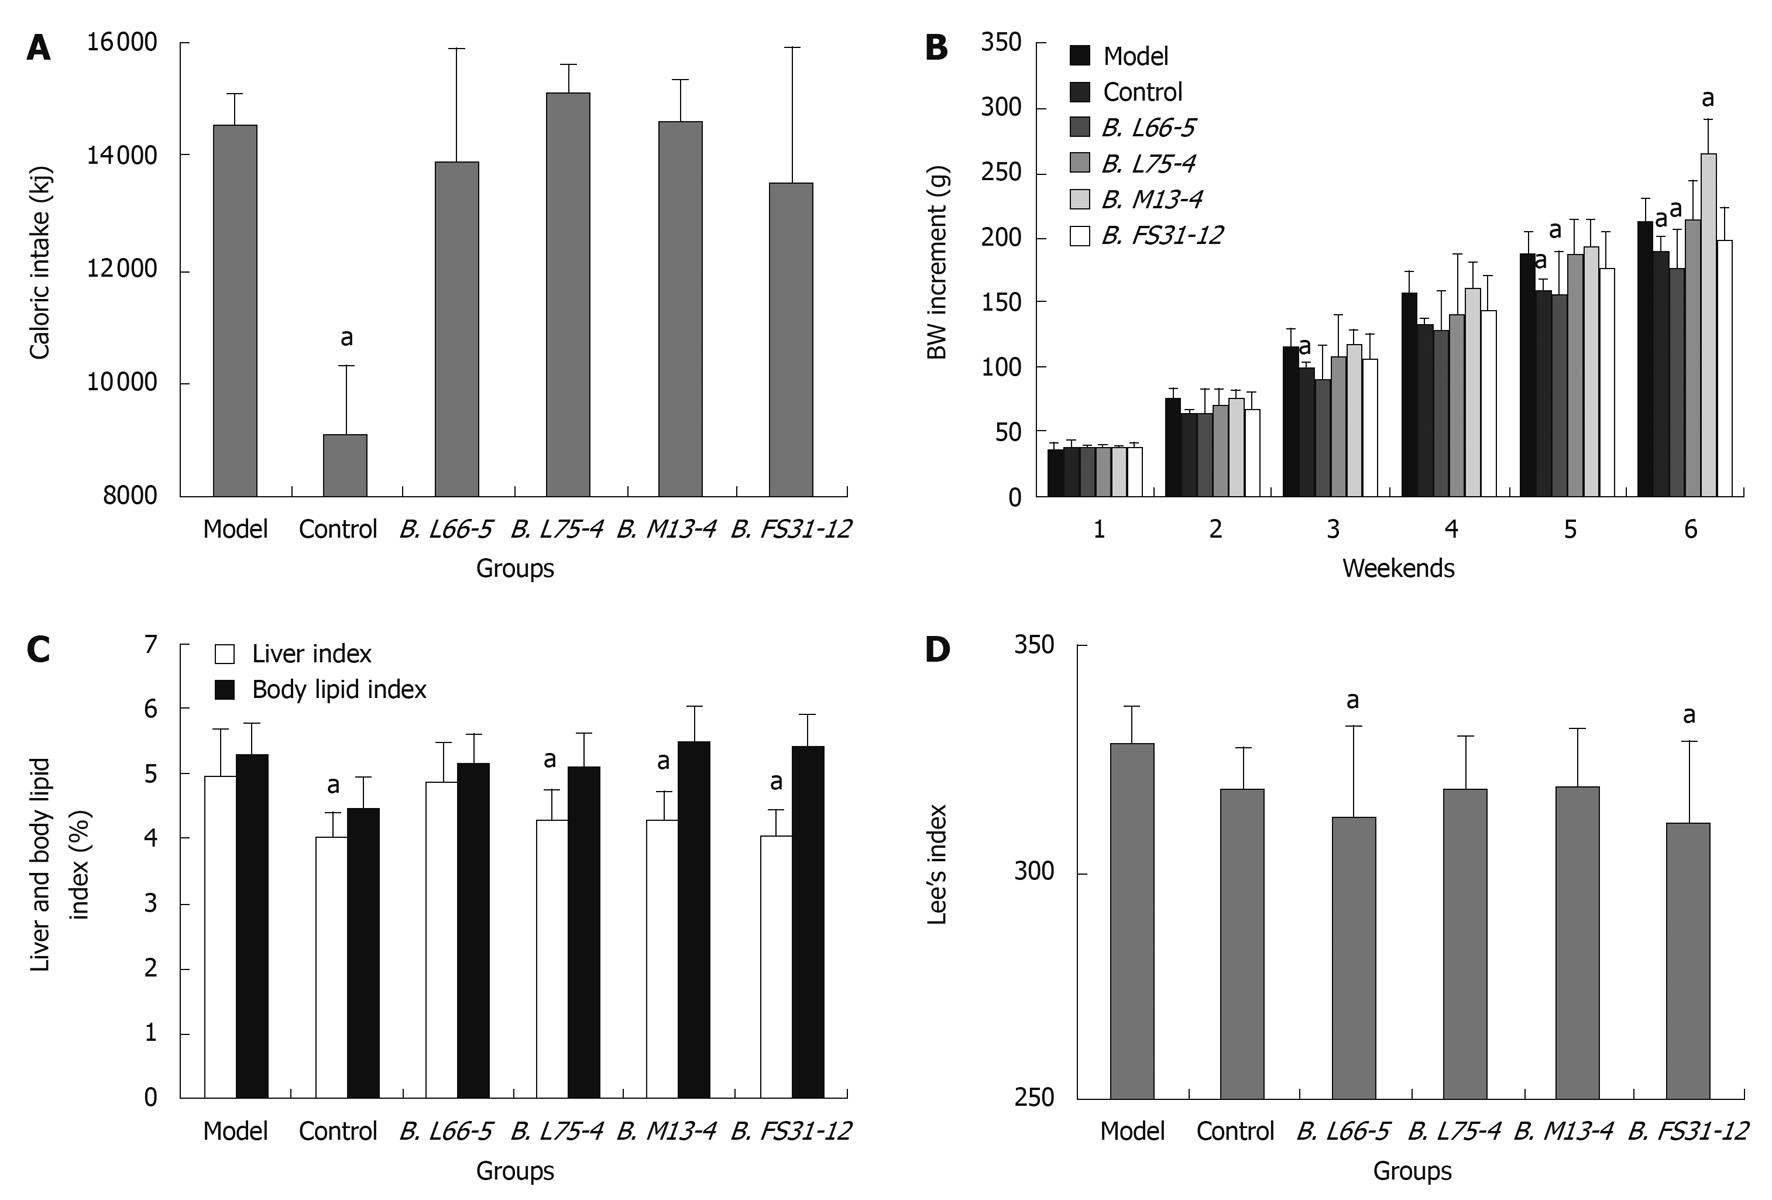
Figure 1 Caloric intake, body weight increment and obesity indexes in high-fat diet treated rats with different strains of Bifidobacteria.
A: Sum of caloric intake in all groups at the 6th weekend; B: Body weight (BW) increment in all groups for 6 wk; C: Liver index and body lipid index in all groups; D: Lee’s index in all groups. Results are shown as mean ± SD (n = 8). aP < 0.05 vs model group.
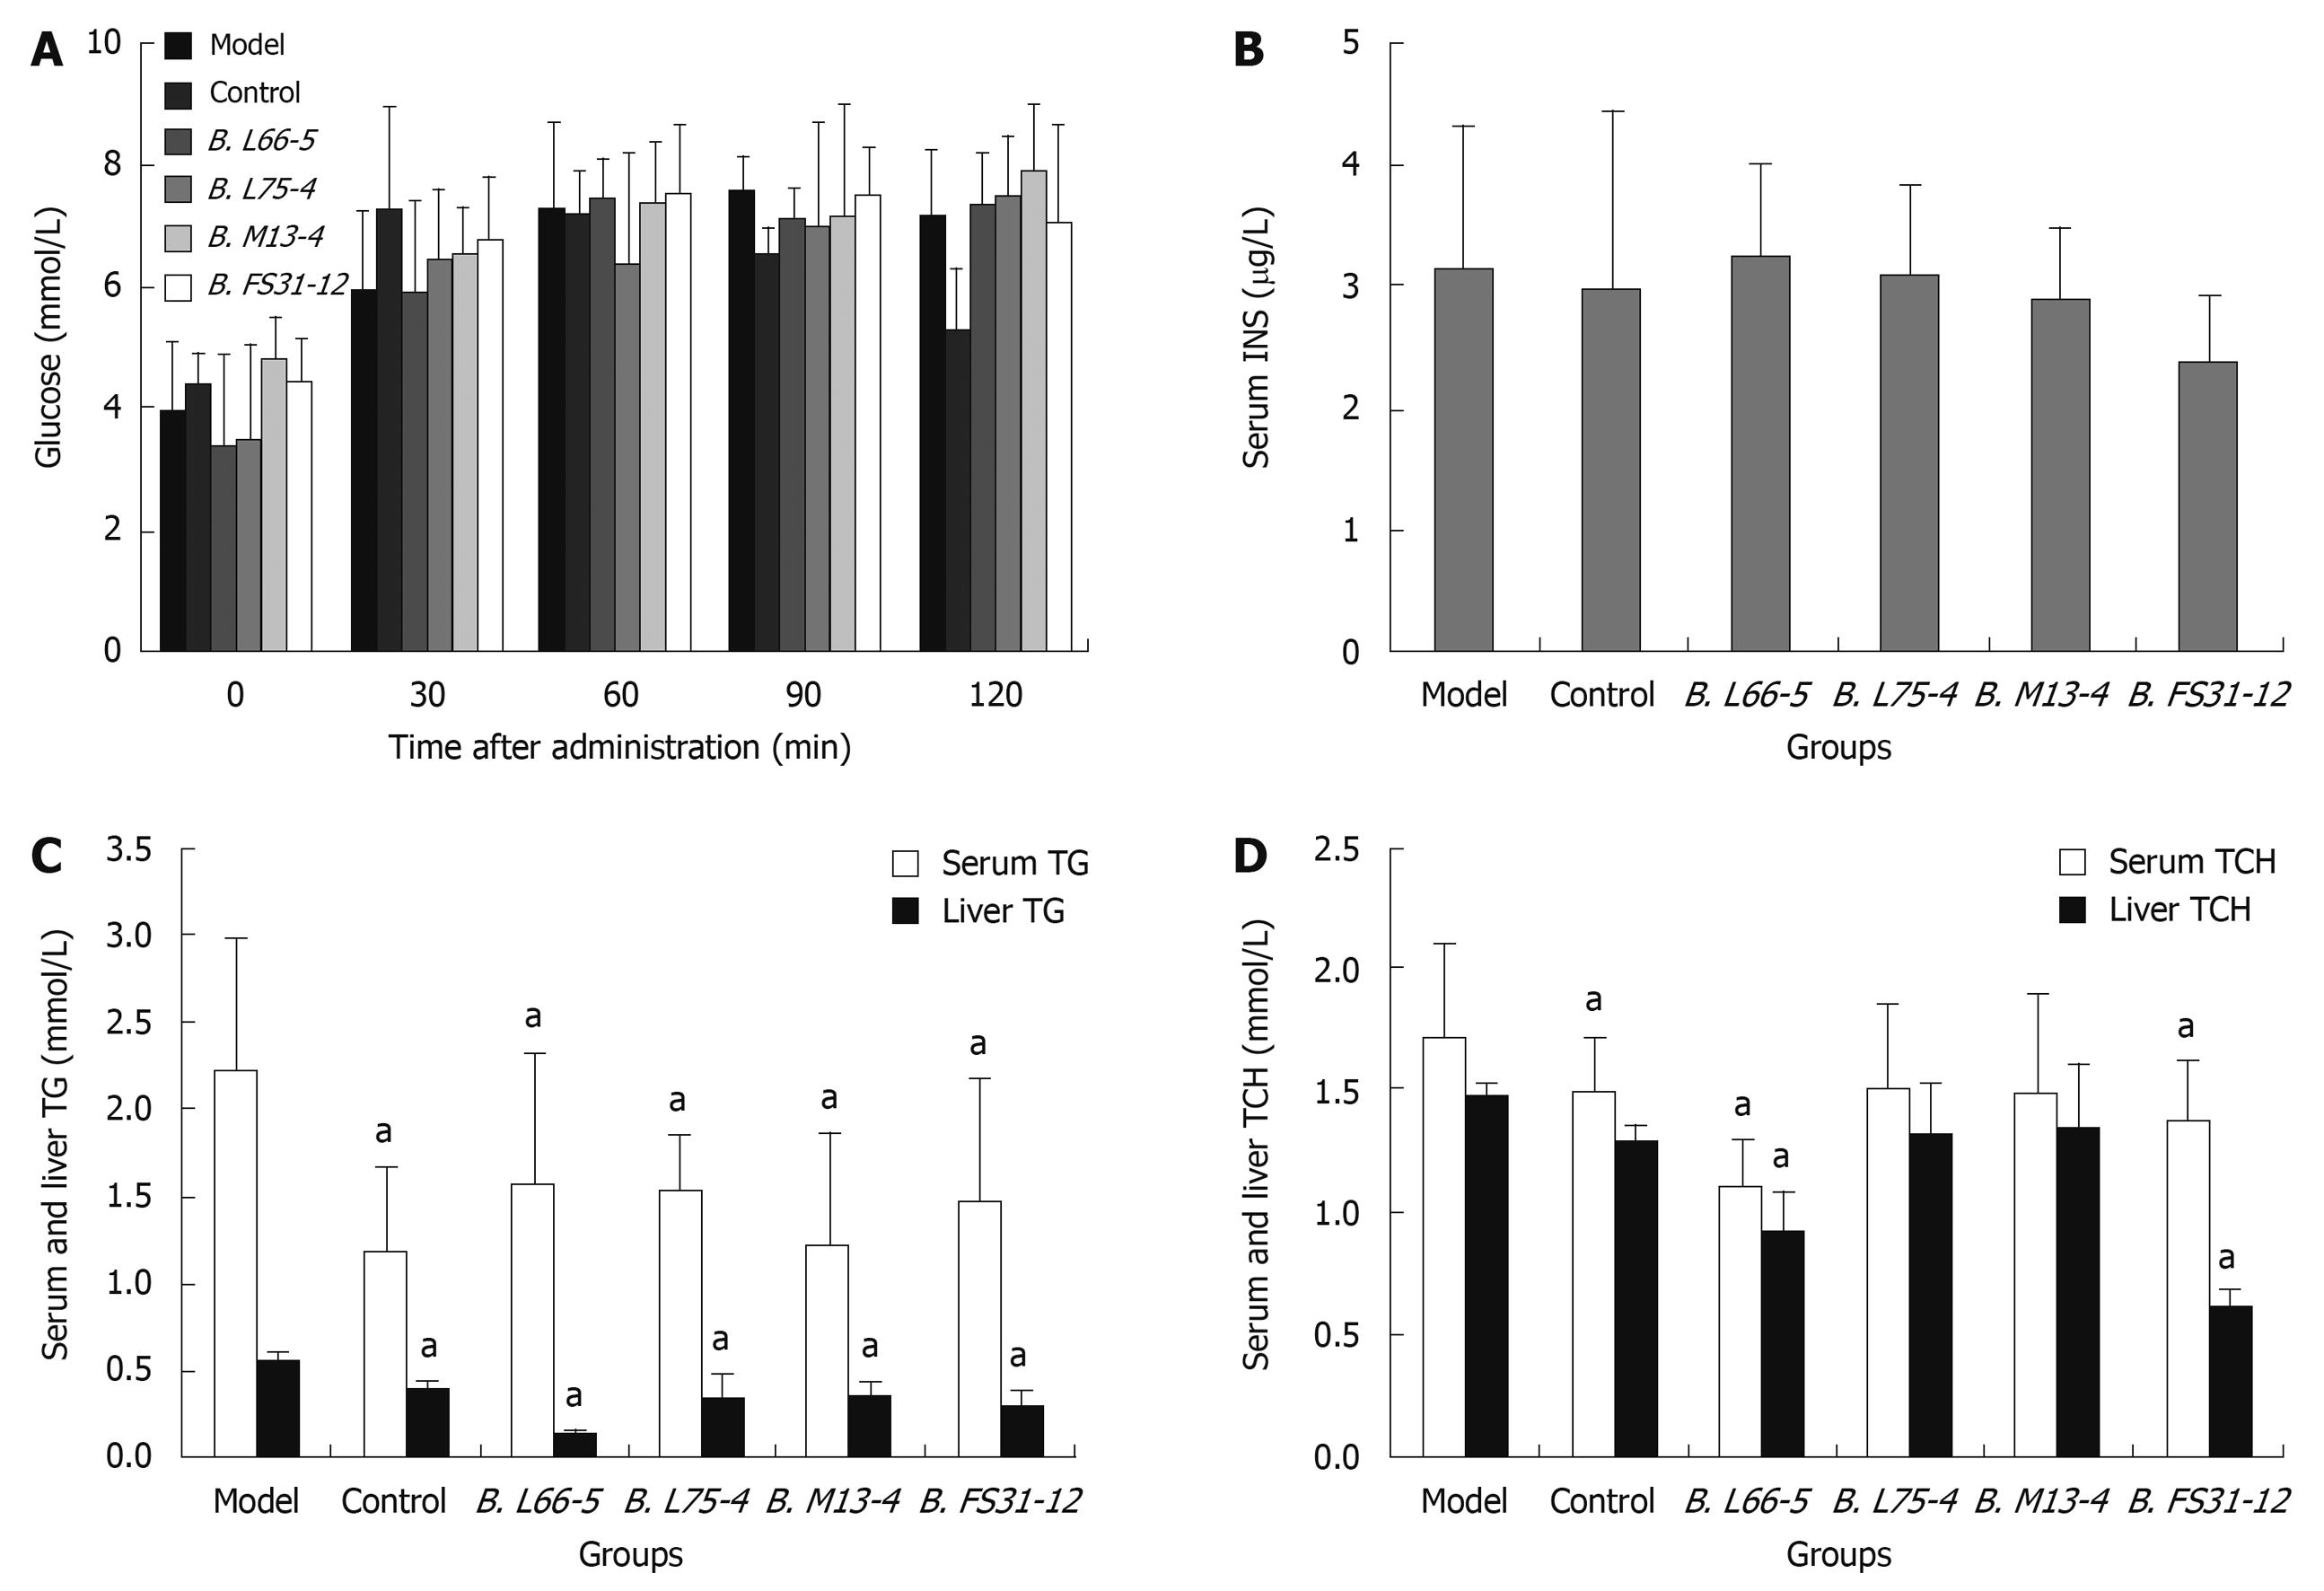
Figure 2 Effects of Bifidobacteria strains on glucose and lipid metabolism in high-fat diet treated rats.
A: Effect of four Bifidobacteria strains on serum glucose; B: Serum insulin (INS) concentration in all groups; C: Serum and liver triglycerides (TG) in all groups; D: Serum and liver total cholesterol (TCH) in all groups. Results are shown as mean ± SD (n = 8), aP < 0.05 vs model group.
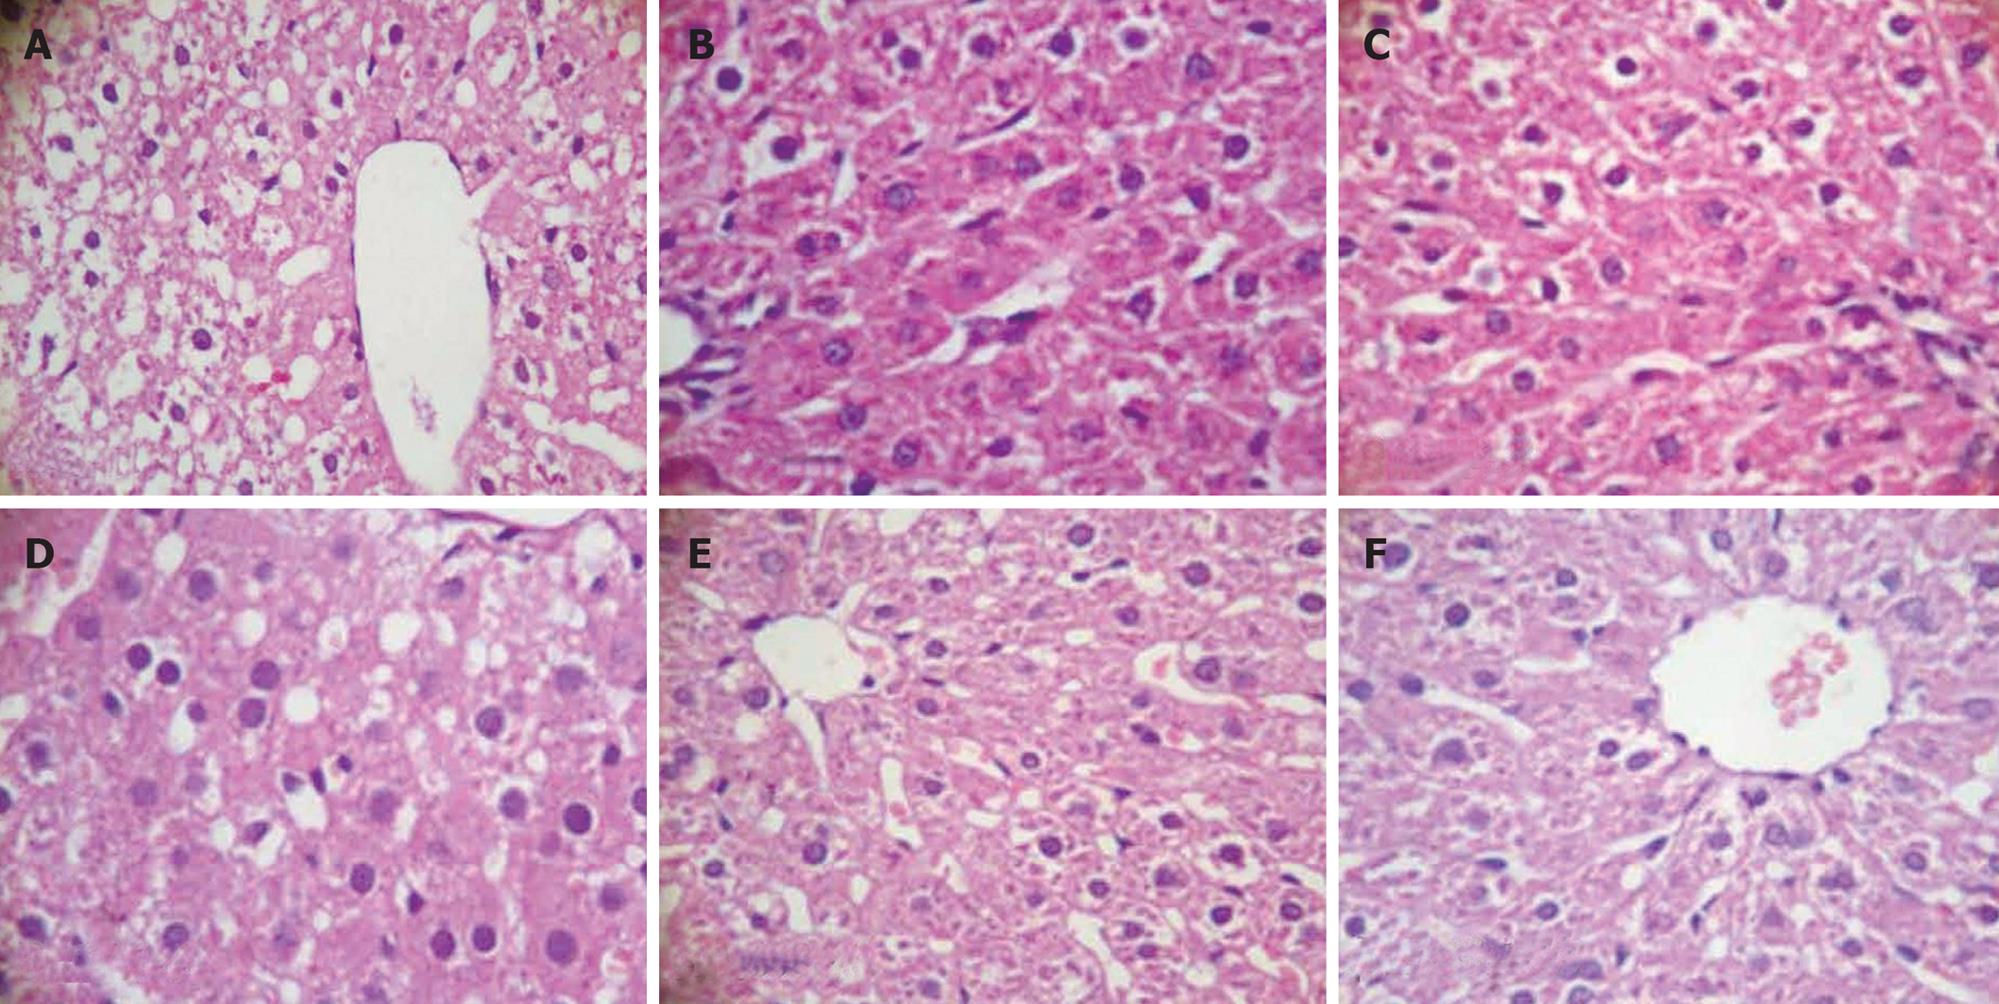
Figure 3 Hepatic tissue sections of each group in HE staining (HE, light microscope, × 400).
A: Model; B: Control; C: B. L66-5; D: B. L75-4; E: B. M13-4; F: B. FS31-12.
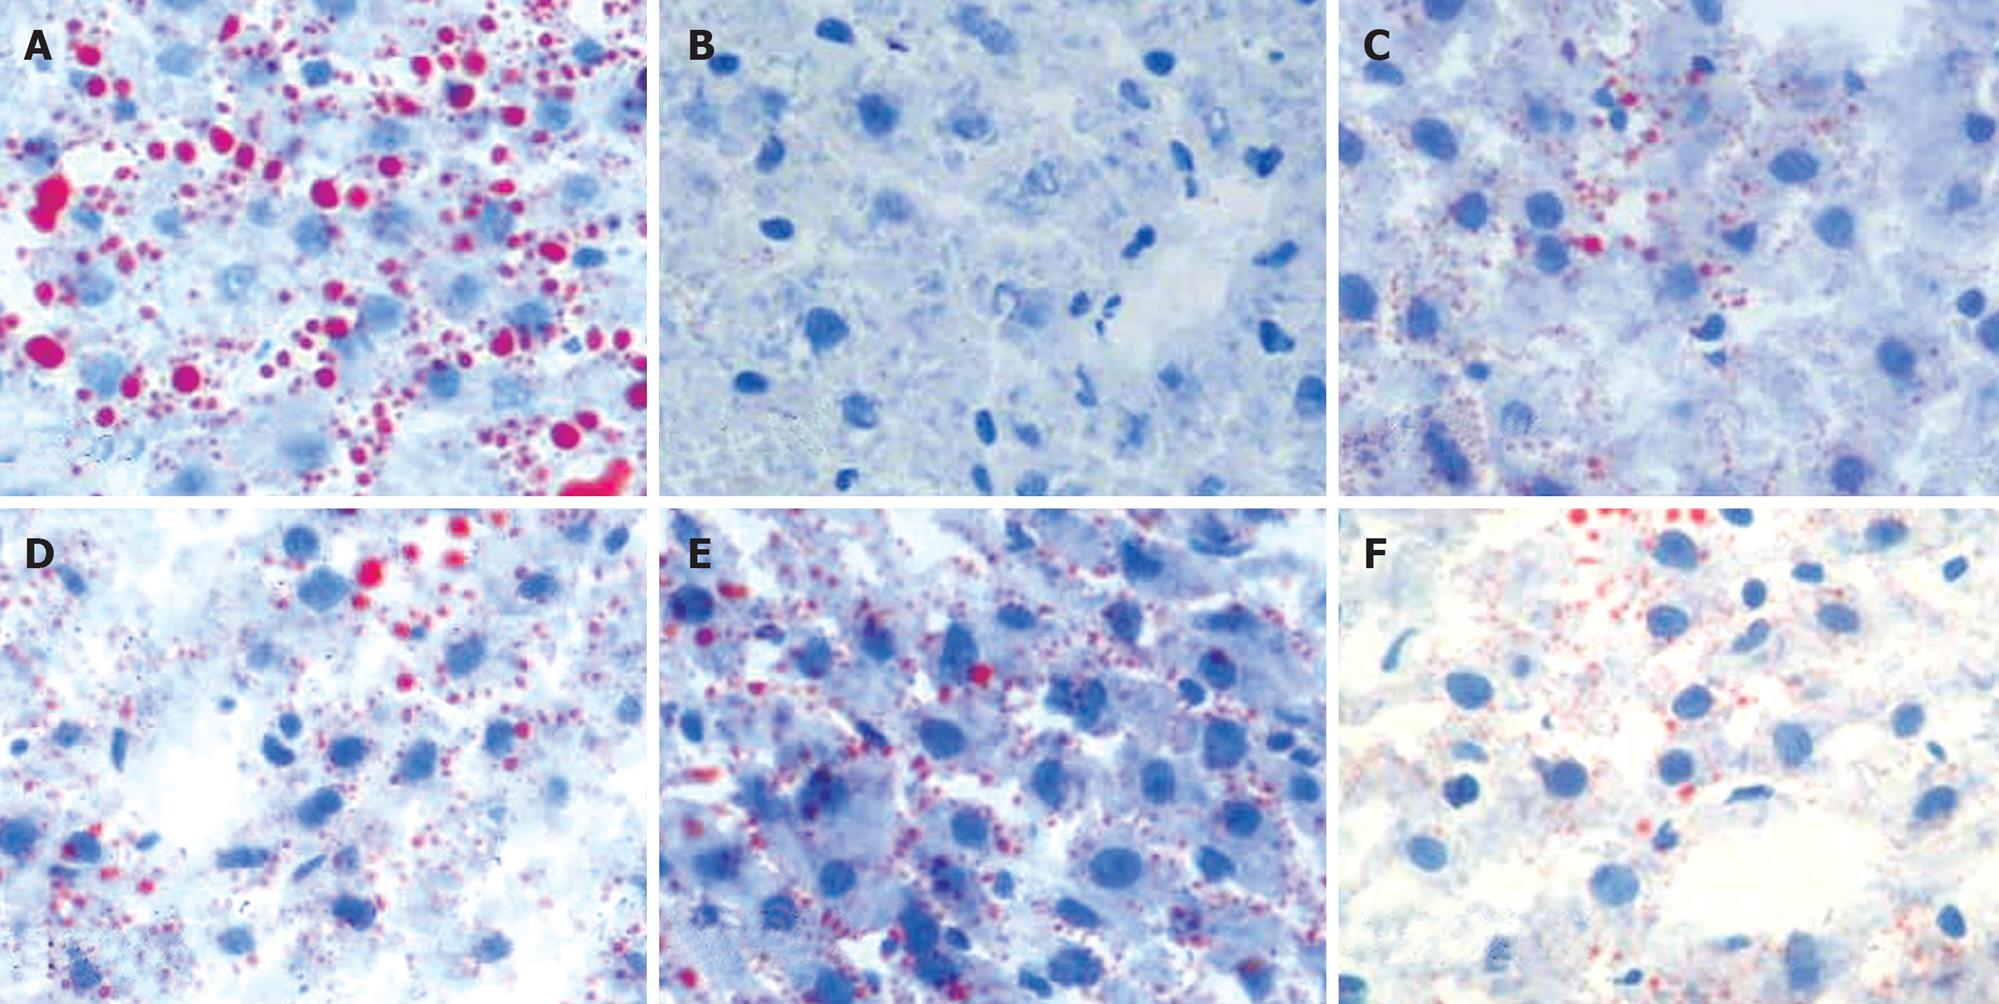
Figure 4 Hepatic tissue sections of each group in Sudan IV-staining (Sudan IV, light microscope, × 400), and lipid droplets are scarlet.
A: Model; B: Control; C: B. L66-5; D: B. L75-4; E: B. M13-4; F: B. FS31-12.
-
Citation: Yin YN, Yu QF, Fu N, Liu XW, Lu FG. Effects of four
Bifidobacteria on obesity in high-fat diet induced rats. World J Gastroenterol 2010; 16(27): 3394-3401 - URL: https://www.wjgnet.com/1007-9327/full/v16/i27/3394.htm
- DOI: https://dx.doi.org/10.3748/wjg.v16.i27.3394


