Copyright
©2010 Baishideng.
World J Gastroenterol. Jul 21, 2010; 16(27): 3377-3384
Published online Jul 21, 2010. doi: 10.3748/wjg.v16.i27.3377
Published online Jul 21, 2010. doi: 10.3748/wjg.v16.i27.3377
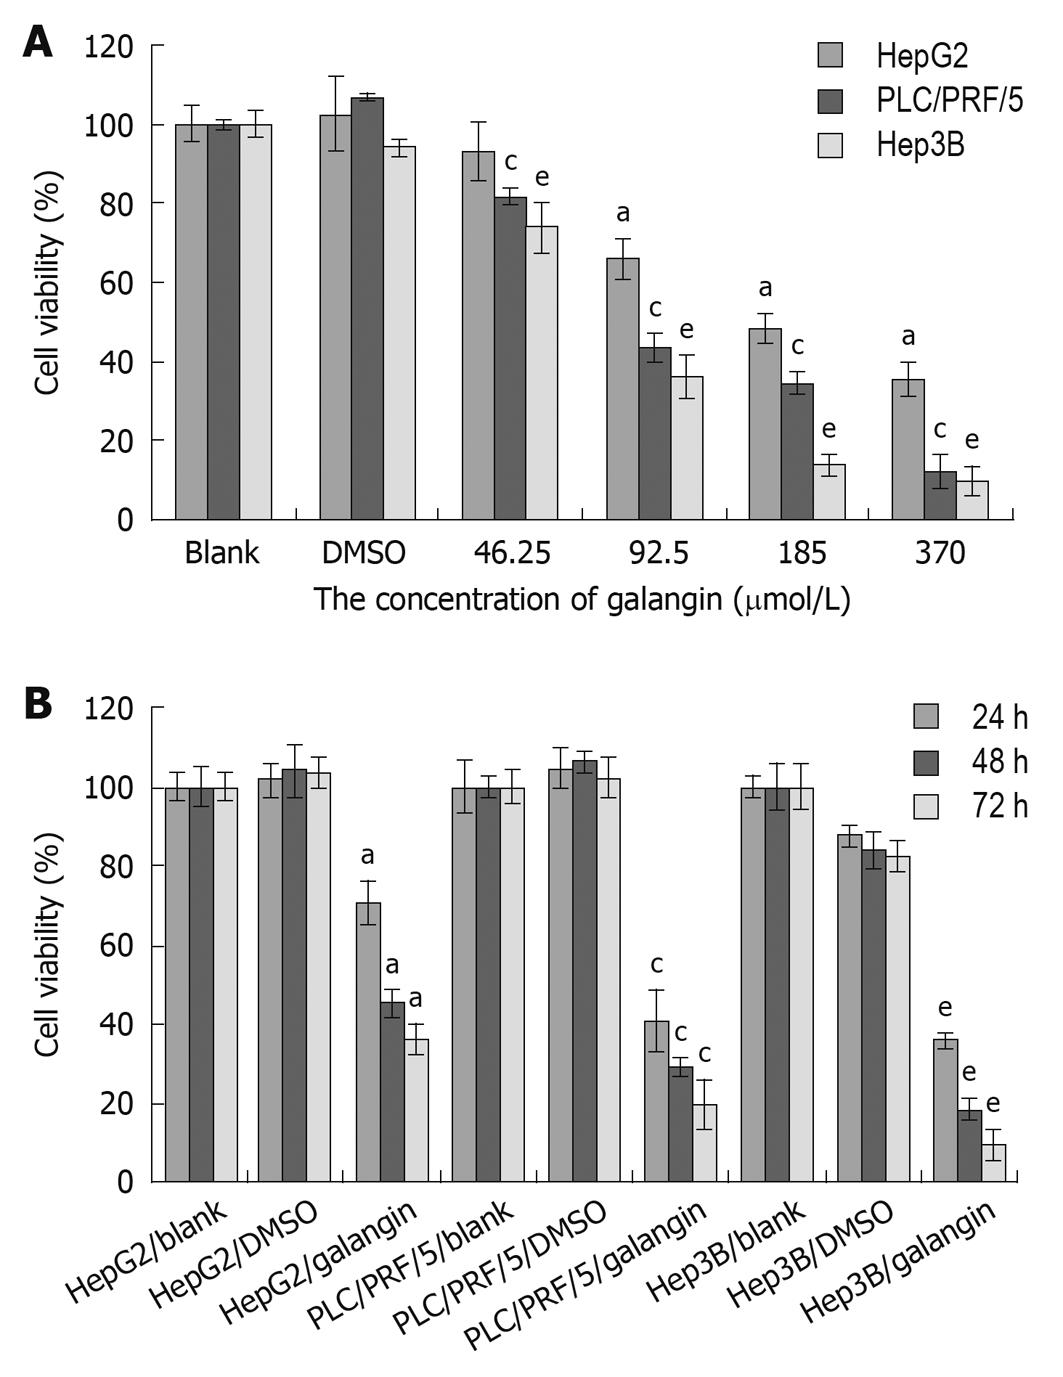
Figure 1 Effects of galangin on cell viability of three hepatocellular carcinoma cell lines.
A: Three hepatocellular carcinoma (HCC) cell lines were treated with 46.25, 92.5, 185, and 370 μmol/L galangin for 24 h. The IC50 of galangin to HepG2, Hep3B, and PLC/PRF/5 cells were 134.0, 87.3 and 79.8 μmol/L, respectively; B: Three HCC cell lines were treated with 92.5 μmol/L galangin for 24, 48 and 72 h. mean ± SD. n = 4. aP < 0.05 vs HepG2 cell/dimethyl sulfoxide (DMSO)-treatment group; cP < 0.05 vs PLC/PRF/5 cell/DMSO-treatment group; eP < 0.05 vs Hep3B/DMSO cell/DMSO-treatment group.
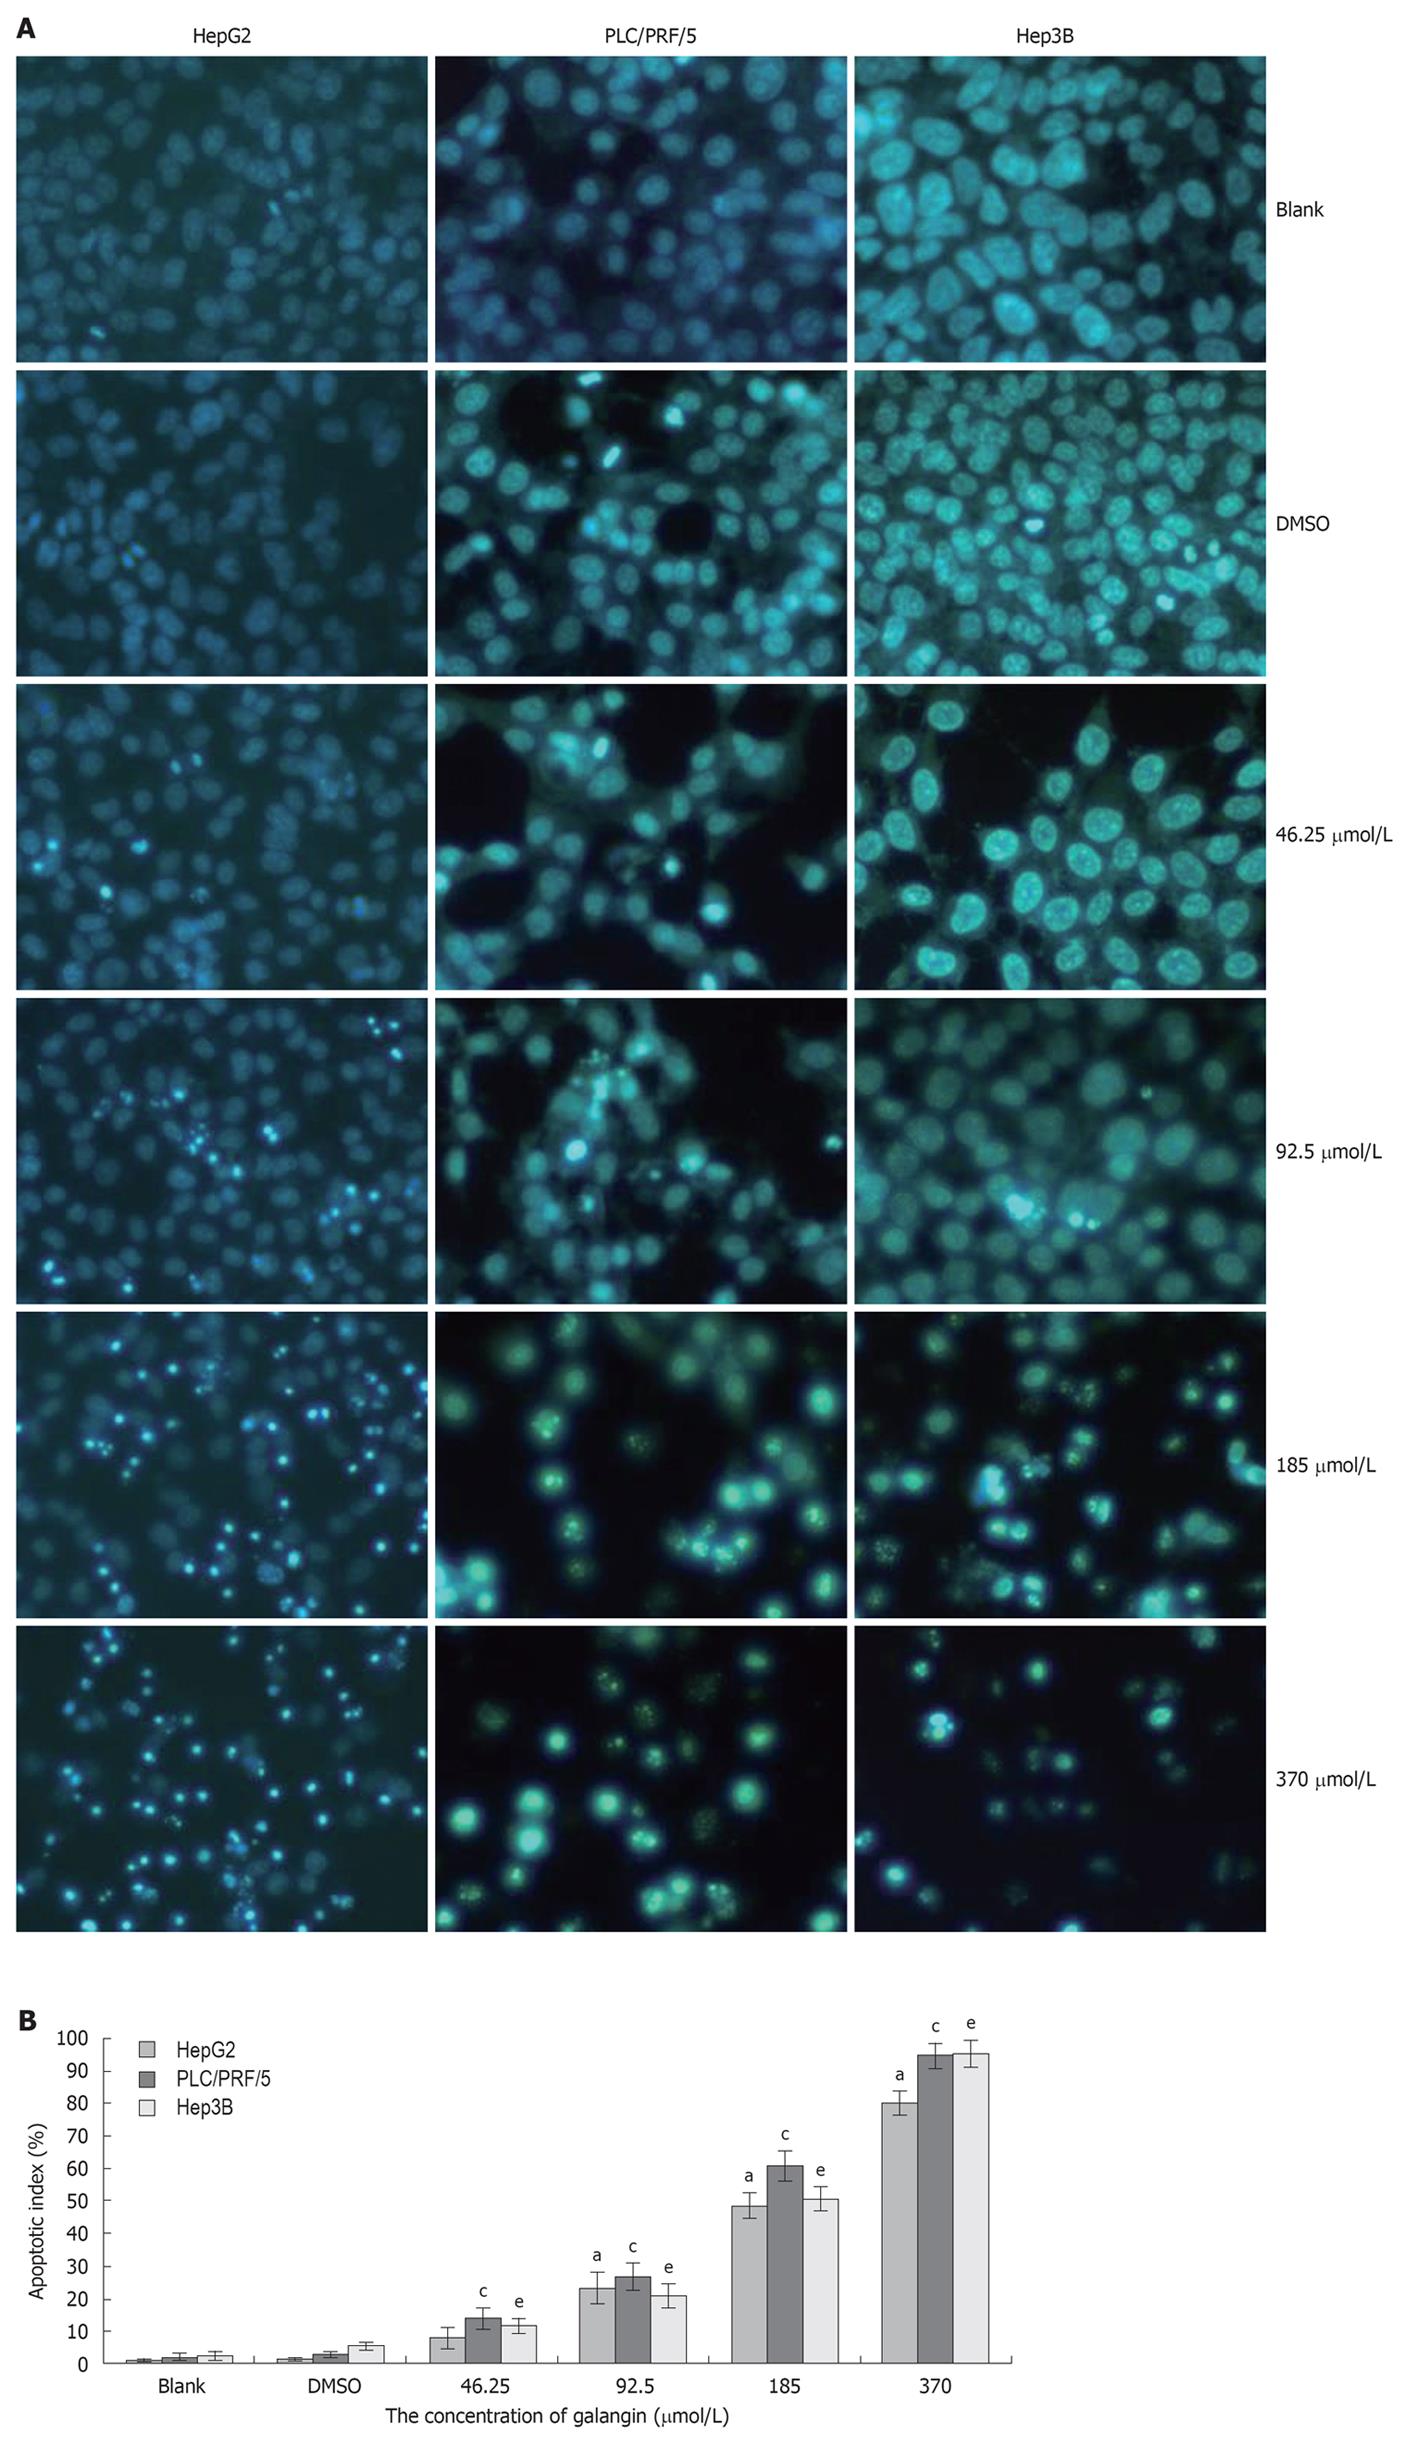
Figure 2 Hepatocellular carcinoma cells apoptosis induced by galangin.
A: Morphology of apoptotic cells, pictures were taken under a 20 × objective; B: Cells were treated with different concentrations of galangin for 24 h and stained with Hoechst 33258/PI to measure apoptosis. mean ± SD. n = 4. aP < 0.05 vs HepG2 cell/dimethyl sulfoxide (DMSO)-treatment group; cP < 0.05 vs PLC/PRF/5 cell/DMSO-treatment group; eP < 0.05 vs Hep3B/DMSO cell/DMSO-treatment group.
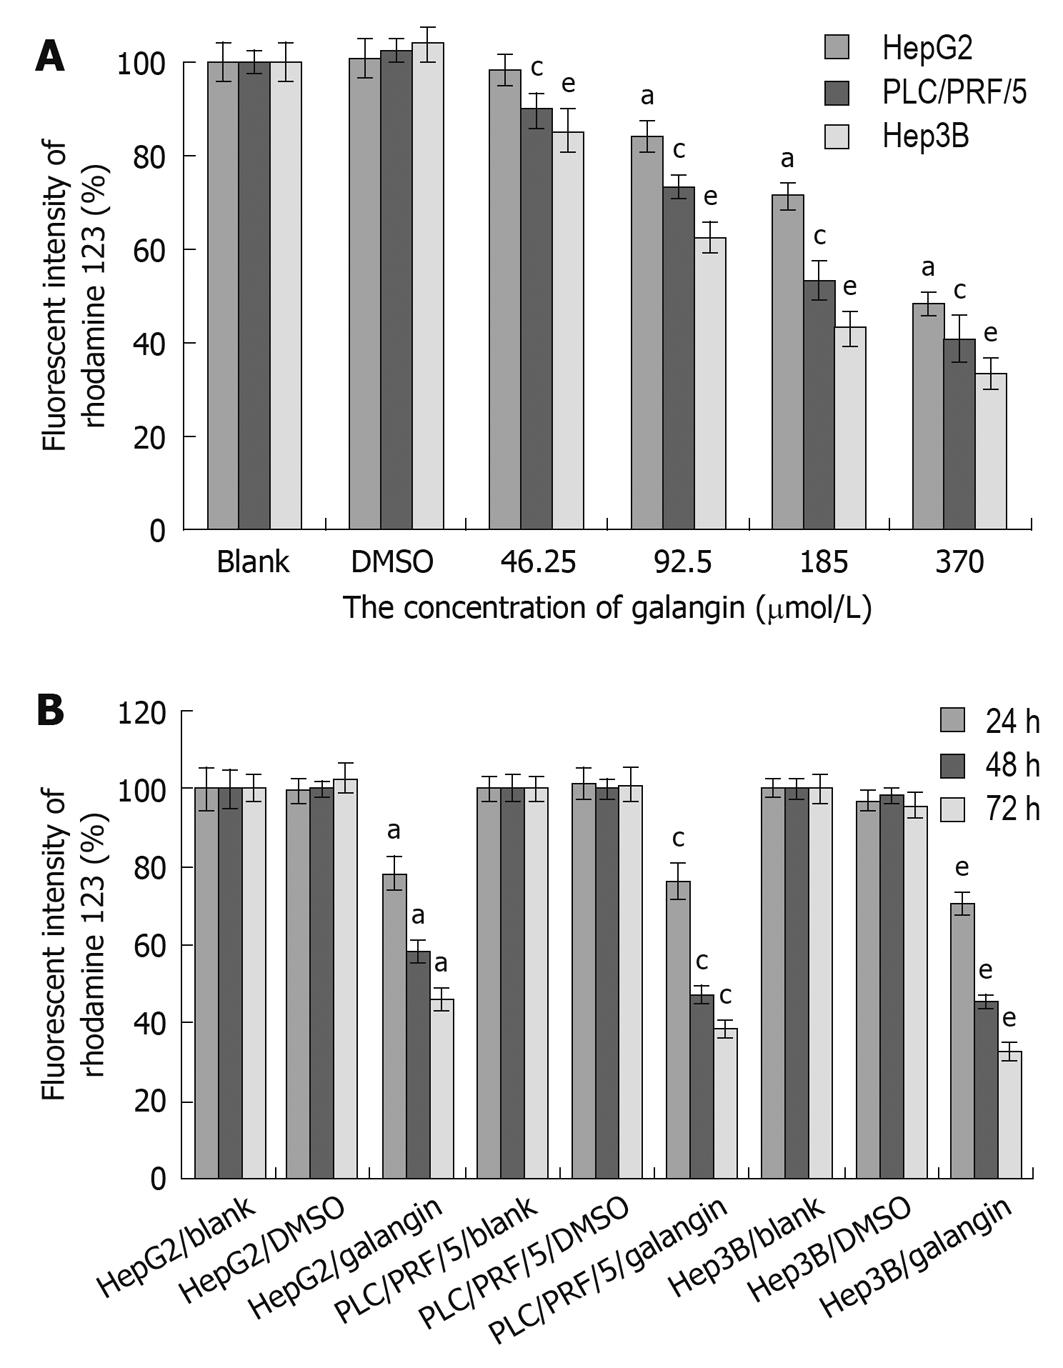
Figure 3 Effect of galangin on the mitochondrial membrane potential of hepatocellular carcinoma cell lines.
A: Three hepatocellular carcinoma (HCC) lines were treated with 46.25, 92.5, 185, and 370 μmol/L galangin for 24 h; B: Three HCC were treated with 92.5 μmol/L galangin for 24, 48 and 72 h. mean ± SD. n = 4. aP < 0.05 vs HepG2 cell/dimethyl sulfoxide (DMSO)-treatment group; cP < 0.05 vs PLC/PRF/5 cell/DMSO-treatment group; eP < 0.05 vs Hep3B/DMSO-treatment group.
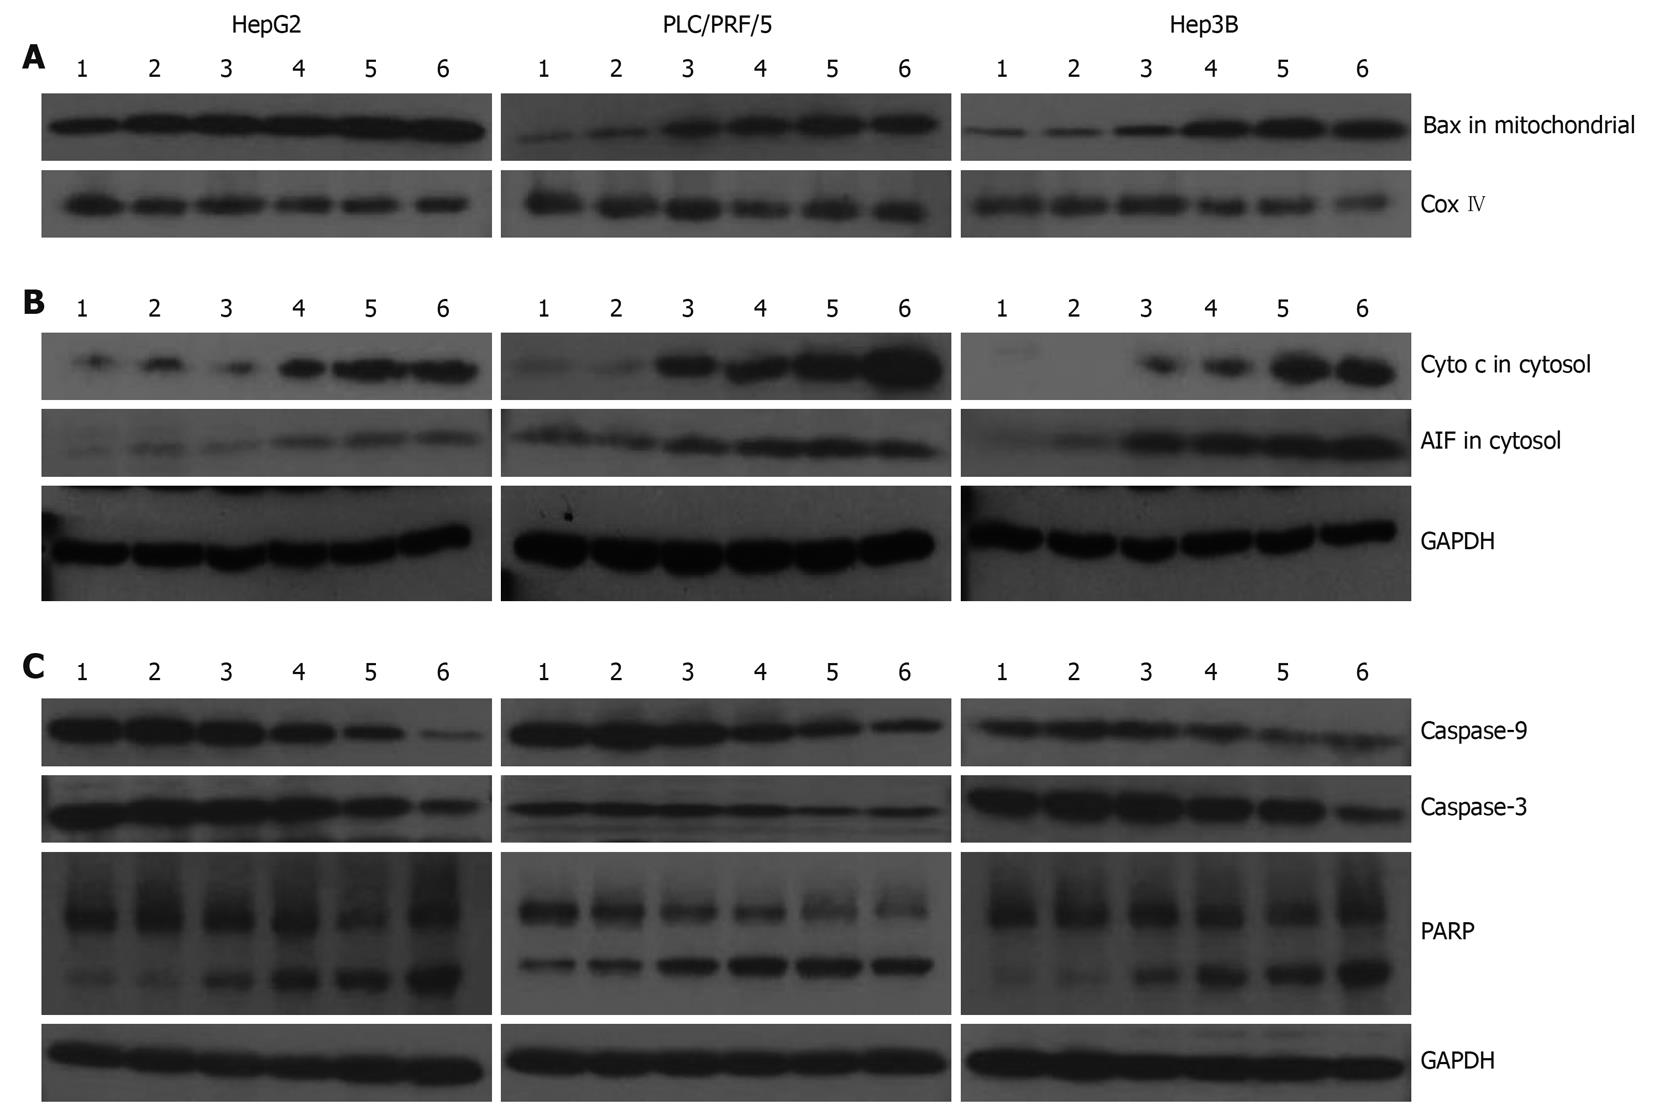
Figure 4 Effects of galangin-treated hepatocellular carcinoma cells on protein expression involved in the mitochondria pathway.
A: The changes of Bax in the mitochondria; B: The changes of cytochrome c and apoptosis-inducing factor (AIF) in the cytosol; C: Caspase-3 and caspase-9 activation, and Poly(ADP-ribose) polymerase (PARP) cleavage induced by galangin. 1: Blank control group; 2: Dimethyl sulfoxide-treatment groups; 3: Cells were treated with 46.25 μmol/L galangin for 24 h; 4: Cells were treated with 92.5 μmol/L galangin for 24 h; 5: Cells were treated with 185 μmol/L galangin for 24 h; 6: Cells were treated with 370 μmol/L galangin for 24 h.
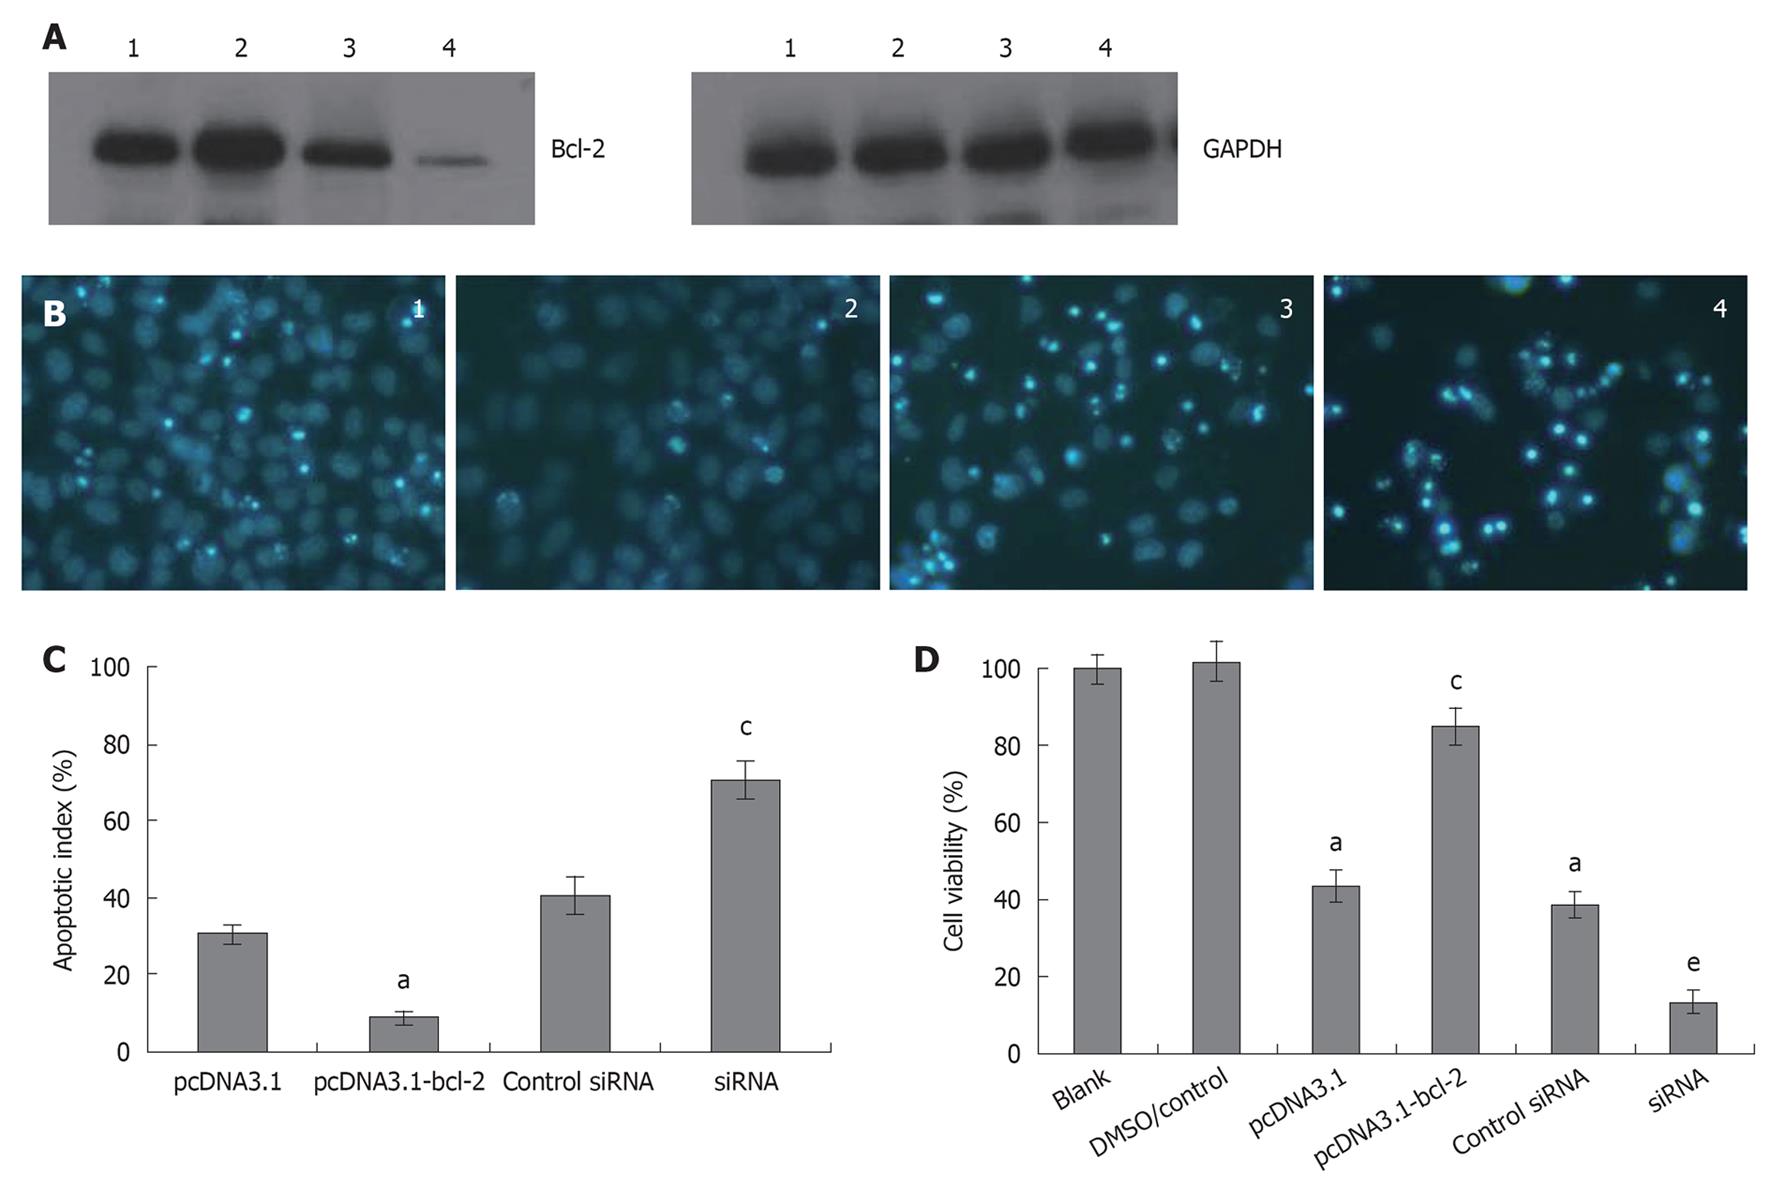
Figure 5 Effects of Bcl-2 on galangin-induced HepG2 cell apoptosis.
A: Bcl-2 protein level was measured in HepG2 cells by Western blotting after cells were transfected; B: Morphology of apoptotic cells. Cells were treated with 185 μmol/L galangin for 24 h and stained with Hoechst 33258/PI to measure apoptosis. Pictures were taken under a 20 × objective. 1: Control vector group; 2: pcDNA3.1-bcl-2-transfected group; 3: Control siRNA group; 4: Bcl-2 siRNA-transfected group; C: Bcl-2 level affect apoptotic index of HepG2 cell induced by galangin. mean ± SD. n = 4. aP < 0.05 vs pcDNA3.1 group; cP < 0.05 vs control siRNA group; D: The effect of Bcl-2 level on cell viability induced by galangin. mean ± SD. n = 4. aP < 0.05 vs HepG2 cell/dimethyl sulfoxide-treatment group; cP < 0.05 vs pcDNA3.1-transfected group; eP < 0.05 vs control siRNA group.
-
Citation: Zhang HT, Luo H, Wu J, Lan LB, Fan DH, Zhu KD, Chen XY, Wen M, Liu HM. Galangin induces apoptosis of hepatocellular carcinoma cells
via the mitochondrial pathway. World J Gastroenterol 2010; 16(27): 3377-3384 - URL: https://www.wjgnet.com/1007-9327/full/v16/i27/3377.htm
- DOI: https://dx.doi.org/10.3748/wjg.v16.i27.3377


