Copyright
©2010 Baishideng.
World J Gastroenterol. May 14, 2010; 16(18): 2291-2297
Published online May 14, 2010. doi: 10.3748/wjg.v16.i18.2291
Published online May 14, 2010. doi: 10.3748/wjg.v16.i18.2291
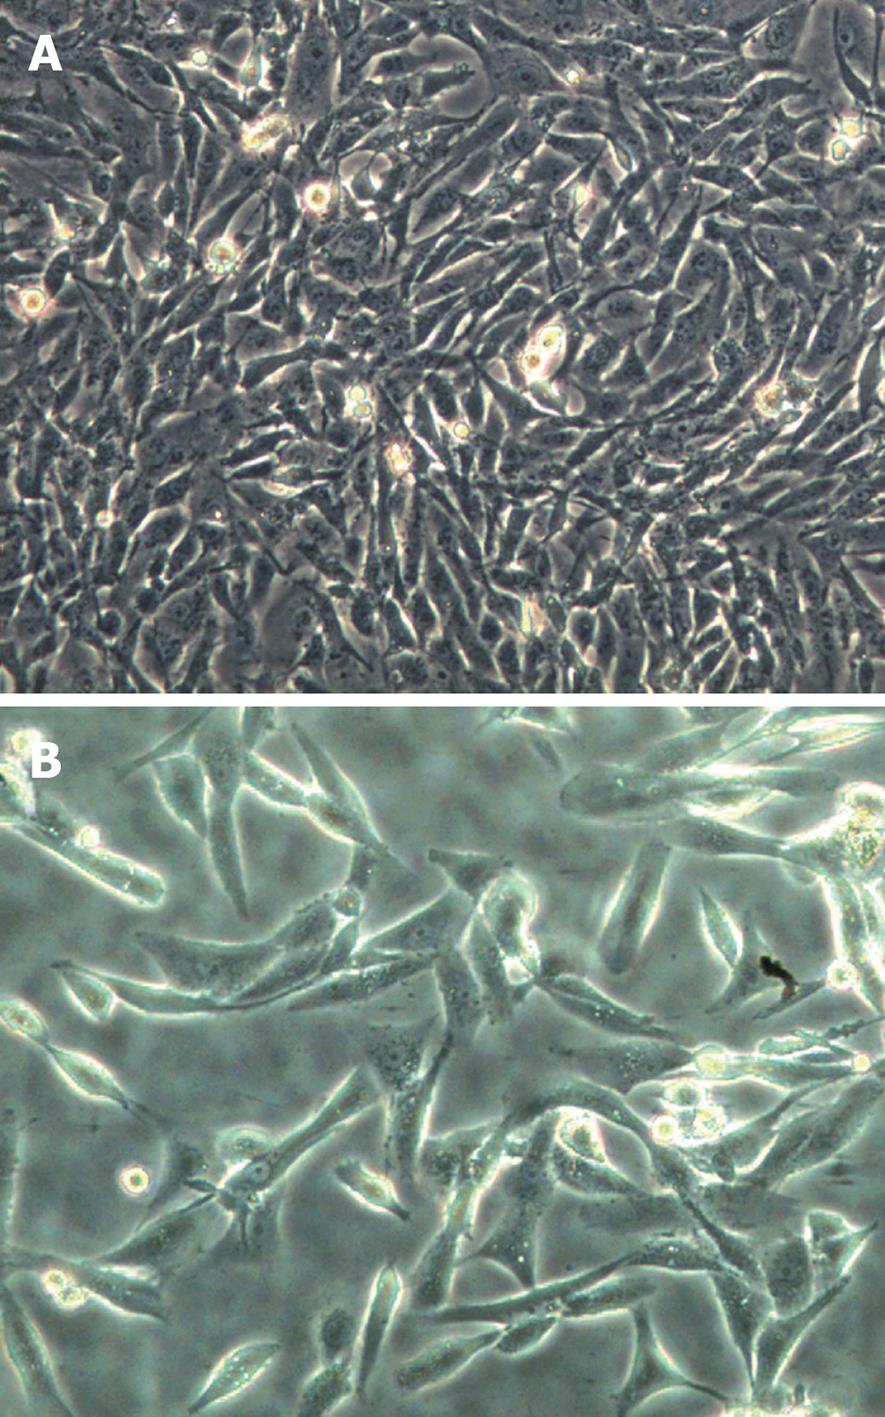
Figure 1 The cell shape of SK-Hep-1 (A) cell line and SK-Hep-1/CDDP (B) cell line (× 100).
SK-Hep-1: A highly invasive human hepatoma cell line with a epithelial-like morphology; SK-Hep-1/CDDP: A cisplatin-resistant cell line from the parental cell line.
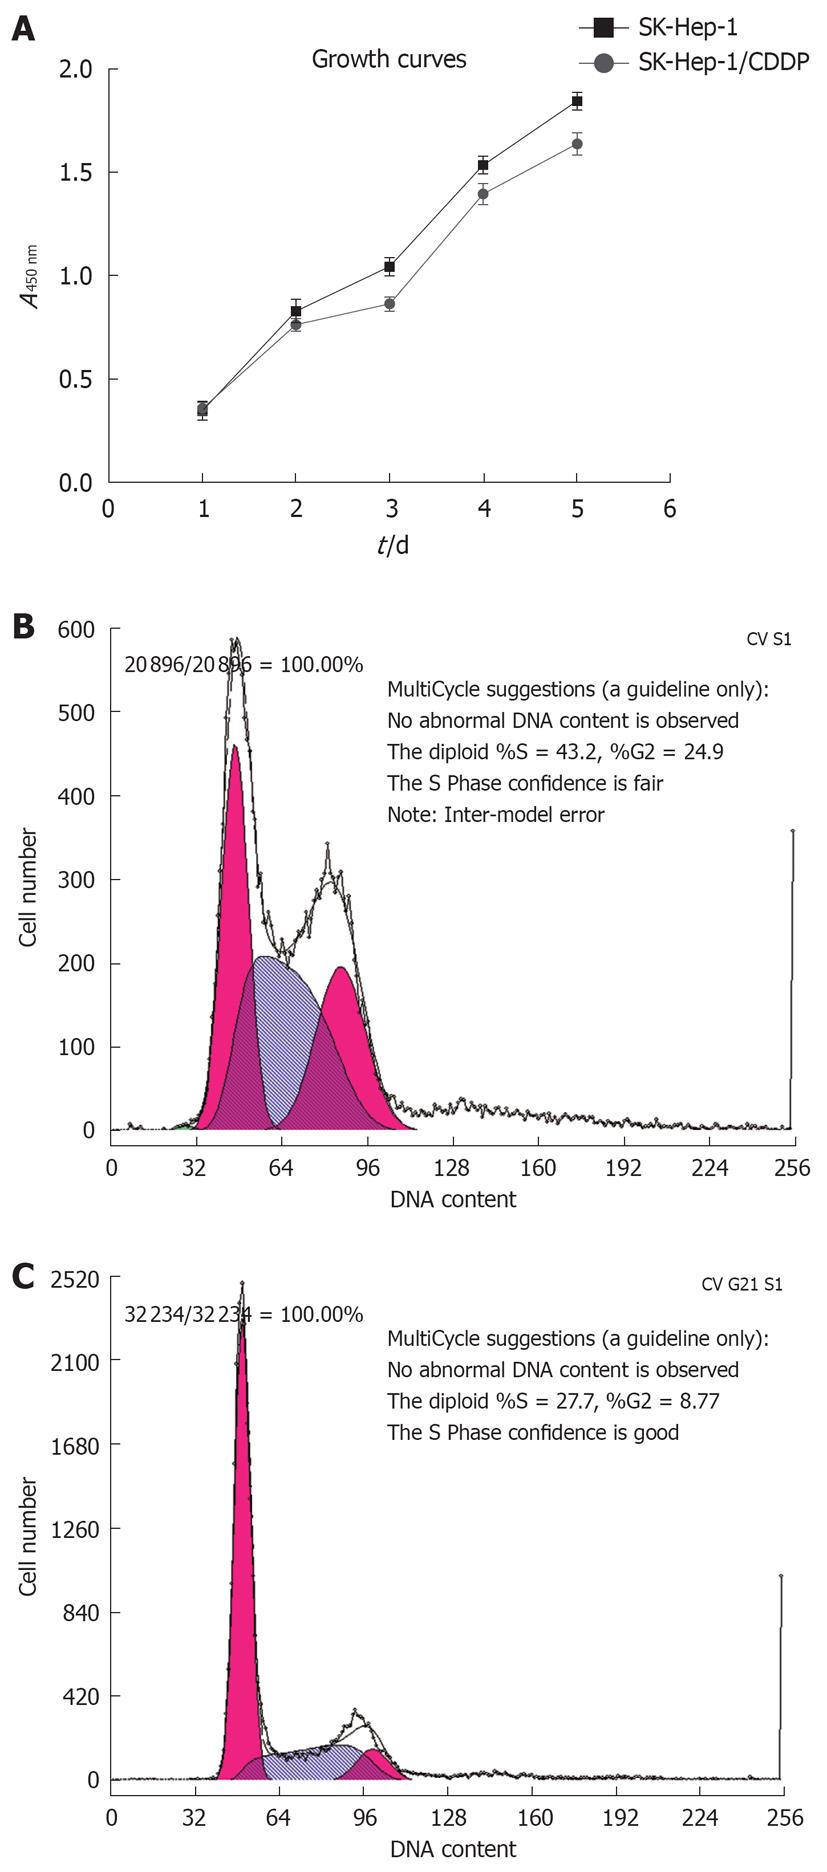
Figure 2 Growth curves of 2 cell lines, SK-Hep-1 and SK-Hep-1/CDDP (A), flow cytometric analysis of cell cycle distribution of SK-Hep-1/CDDP (B) and SK-Hep-1 (C).
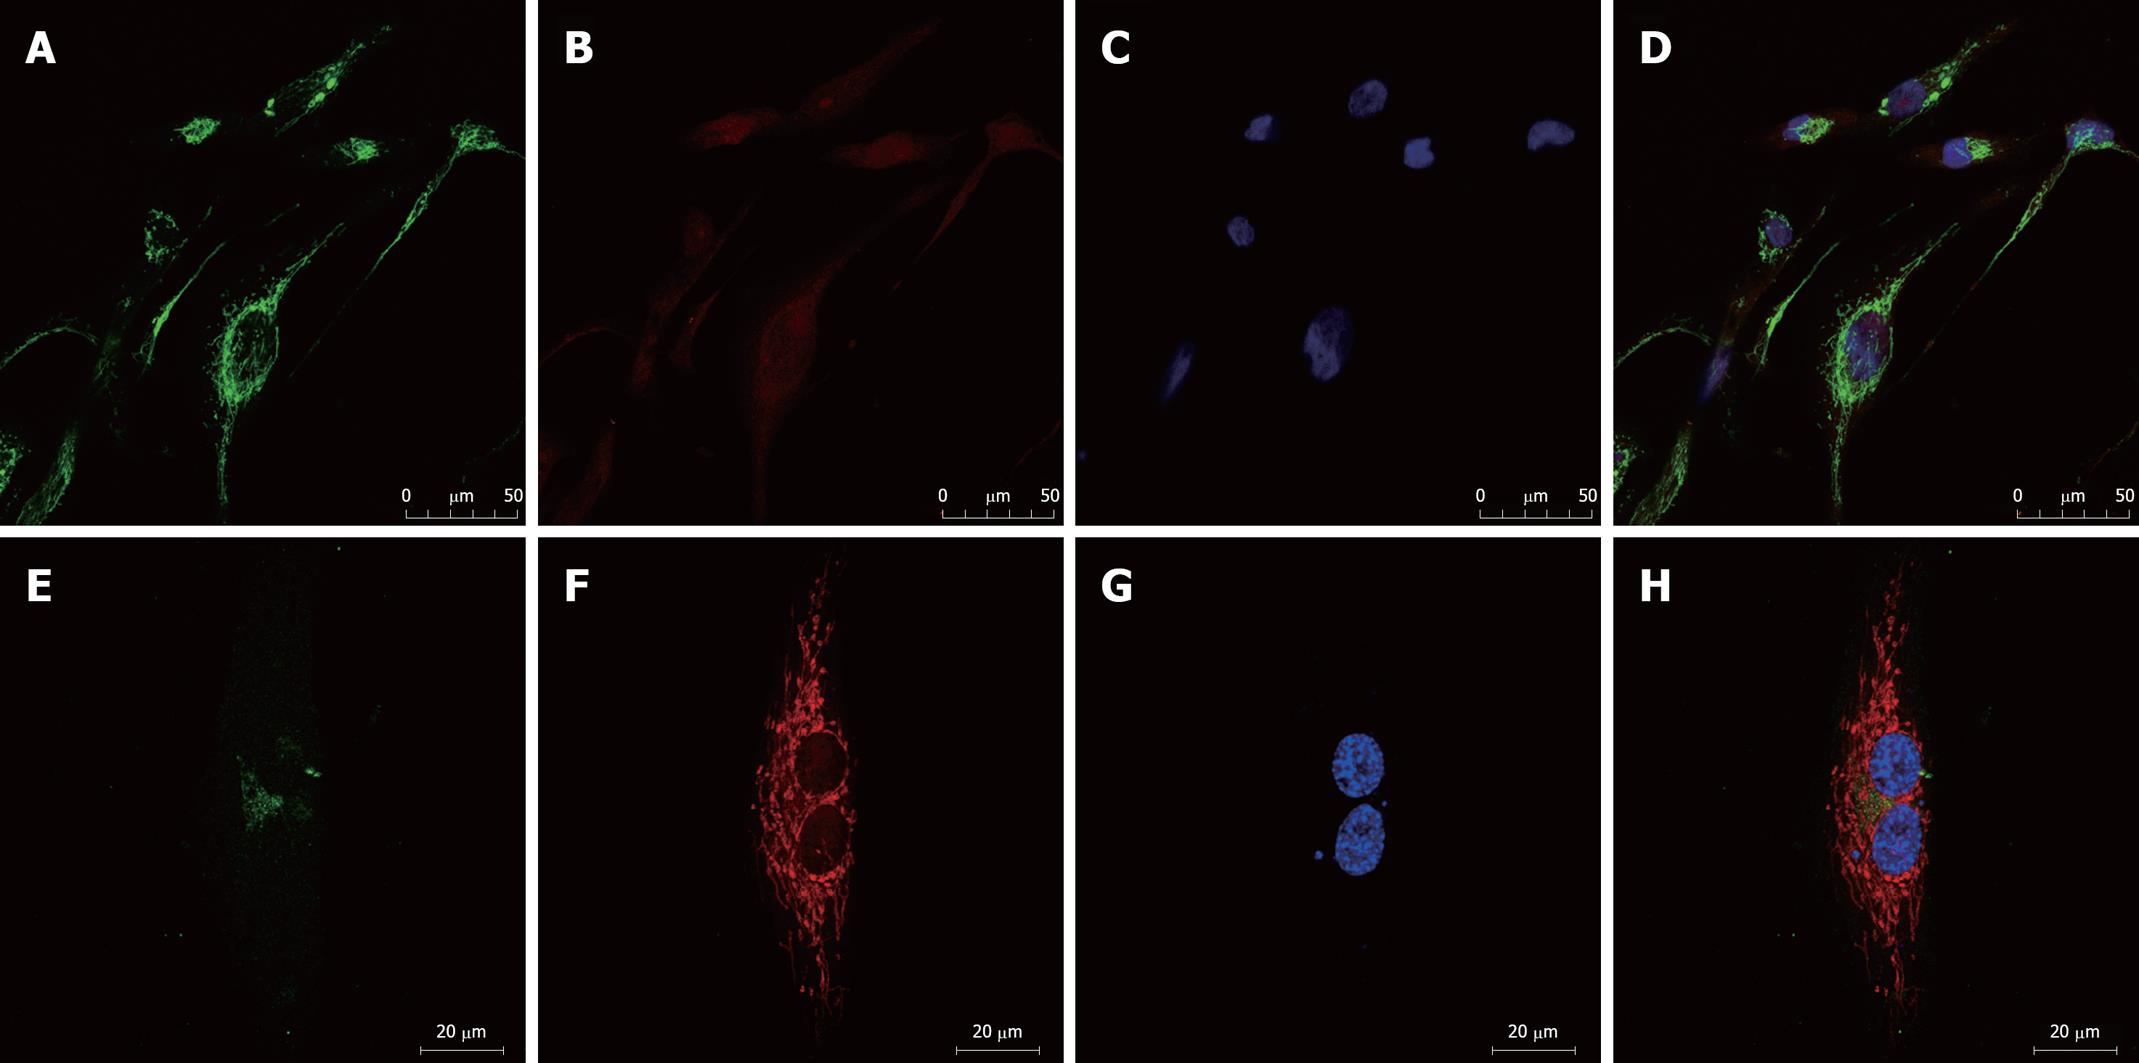
Figure 3 Laser scanning confocal microscopy for MDR1/P-gp in resistance SK-Hep-1/CDDP (A-D) and parent SK-Hep-1 (E-H) cell lines.
SK-Hep-1/CDDP (A) and SK-Hep-1 (E) cells were simultaneously stained for the anti-P-gp antibody-FITC (green), (B) and (F) were stained with mitochondria (red), (C) and (G) immunofluorescence images for the nuclei (blue), (D) and (H) the expression of the merged image. MDR1: Multidrug resistant protein 1; P-gp: Phospho-glycoprotein.
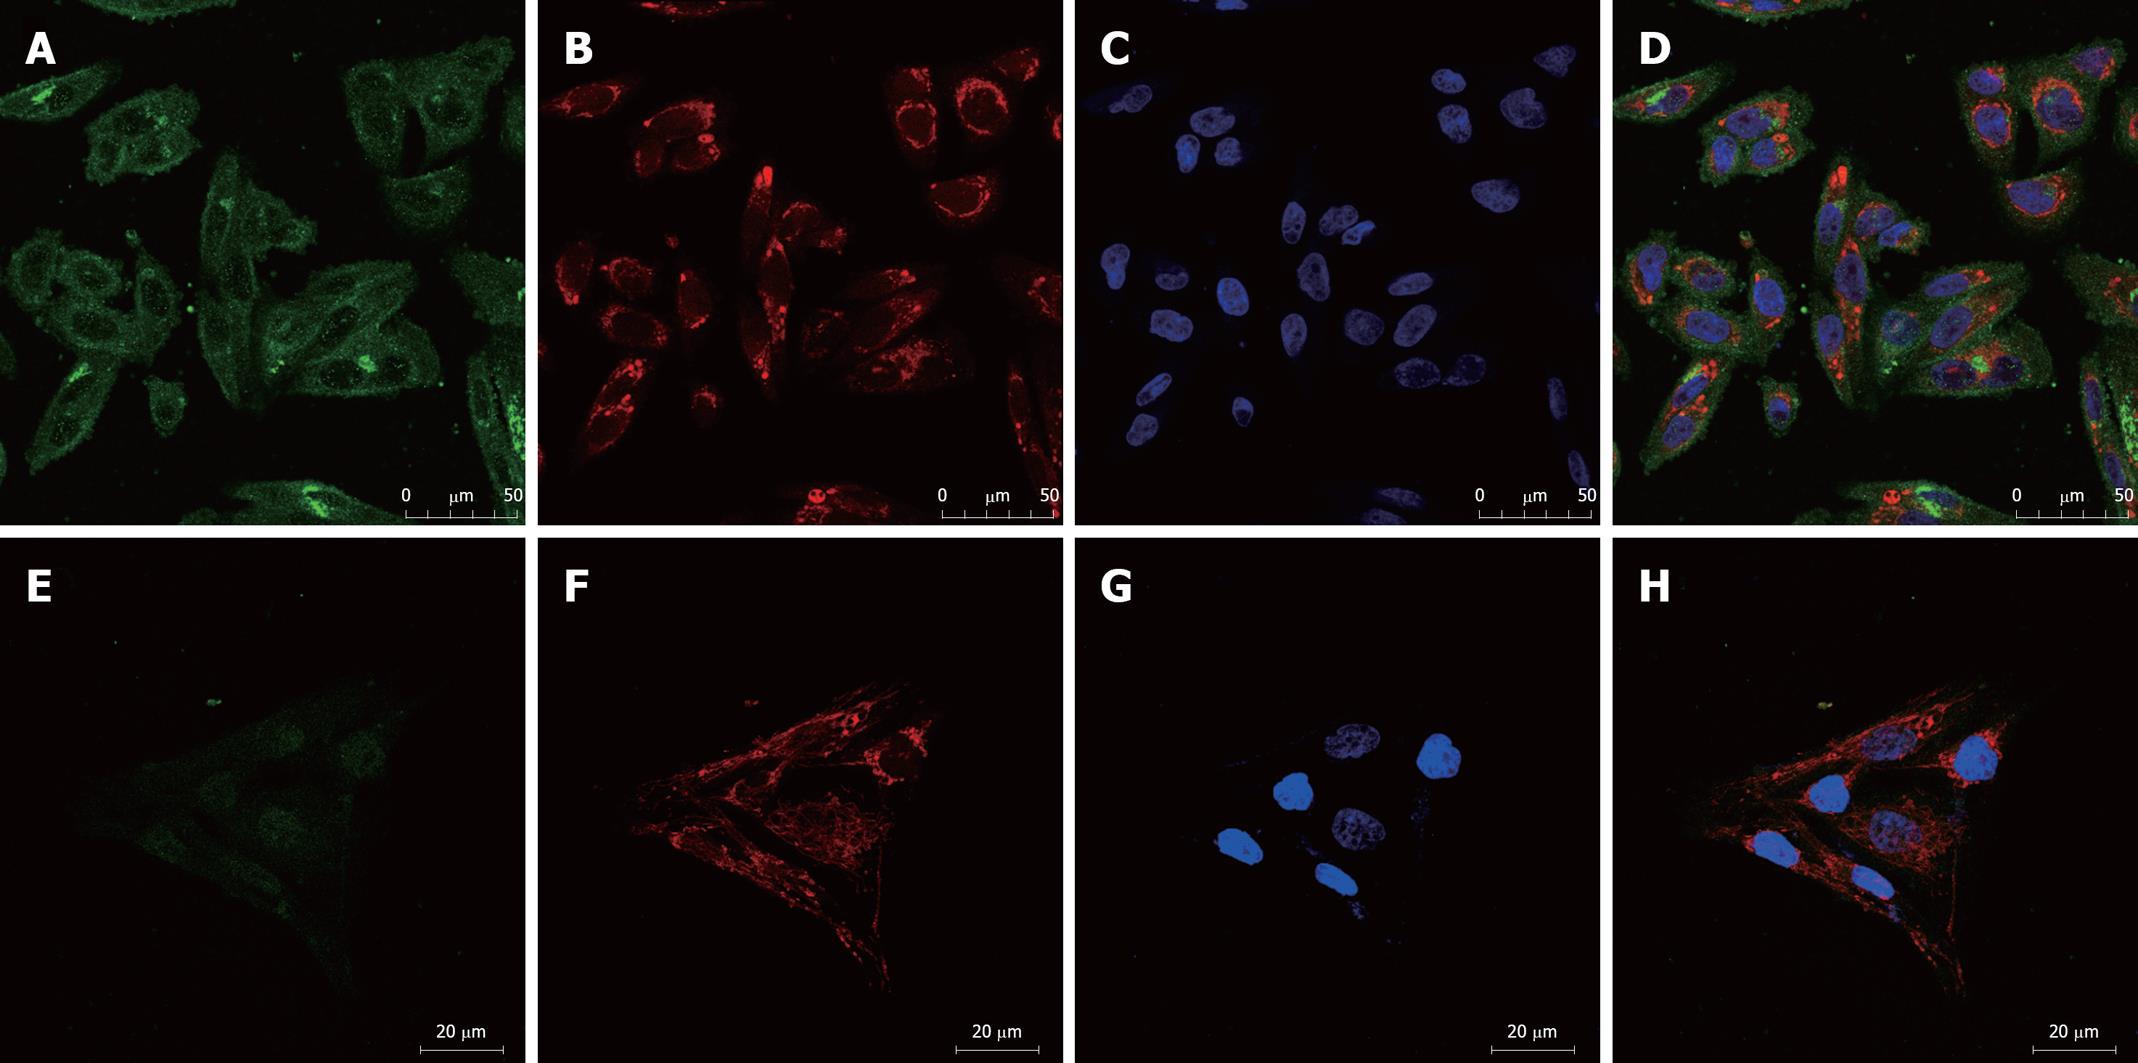
Figure 4 Overexpression of MRP1 in resistant SK-Hep-1/CDDP (A-D) and SK-Hep-1 (E-H) cell lines.
Immunofluorescence images for MRP1 (A and E, green), mitochondria (B and F, red), and nuclei (C and G) on the same section were merged to illustrate areas of overlap (D and H). MRP1: Multidrug resistance-associated protein 1.
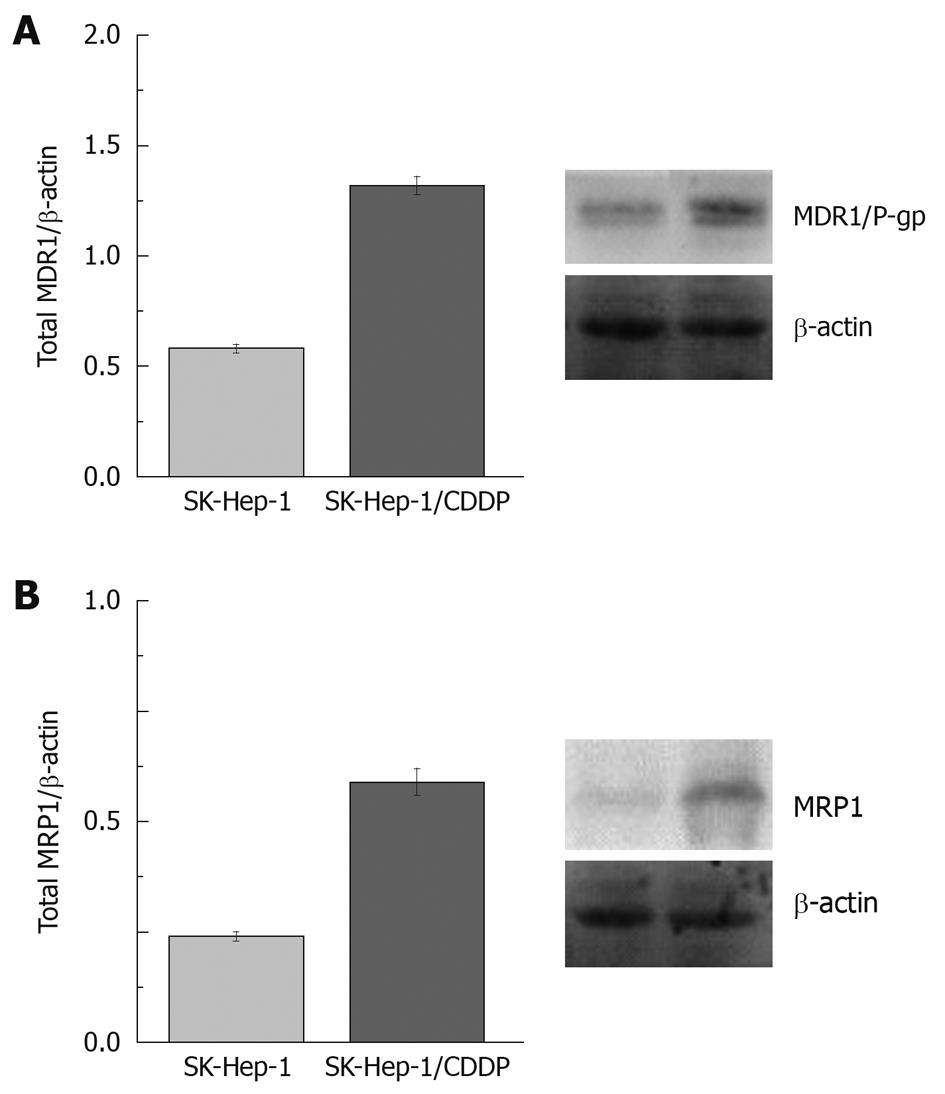
Figure 5 Representative Western blotting of total protein extracts from SK-Hep-1 and SK-Hep-1/CDDP cells.
A: Left: The relative level of MDR1/β-actin in each cell line in the bar graph (P < 0.05, n = 3). Right: Western blotting analysis of MDR1/P-gp; B: Left: The relative level of MRP1/β-actin in each cell line in the bar graph (P < 0.05, n = 3). Right: Expression level of total MRP1 protein in SK-Hep-1 and SK-Hep-1/CDDP cells. The data are representative of those obtained in 3 other experiments.
-
Citation: Zhou Y, Ling XL, Li SW, Li XQ, Yan B. Establishment of a human hepatoma multidrug resistant cell line
in vitro . World J Gastroenterol 2010; 16(18): 2291-2297 - URL: https://www.wjgnet.com/1007-9327/full/v16/i18/2291.htm
- DOI: https://dx.doi.org/10.3748/wjg.v16.i18.2291


