Copyright
©2010 Baishideng.
World J Gastroenterol. May 14, 2010; 16(18): 2235-2243
Published online May 14, 2010. doi: 10.3748/wjg.v16.i18.2235
Published online May 14, 2010. doi: 10.3748/wjg.v16.i18.2235
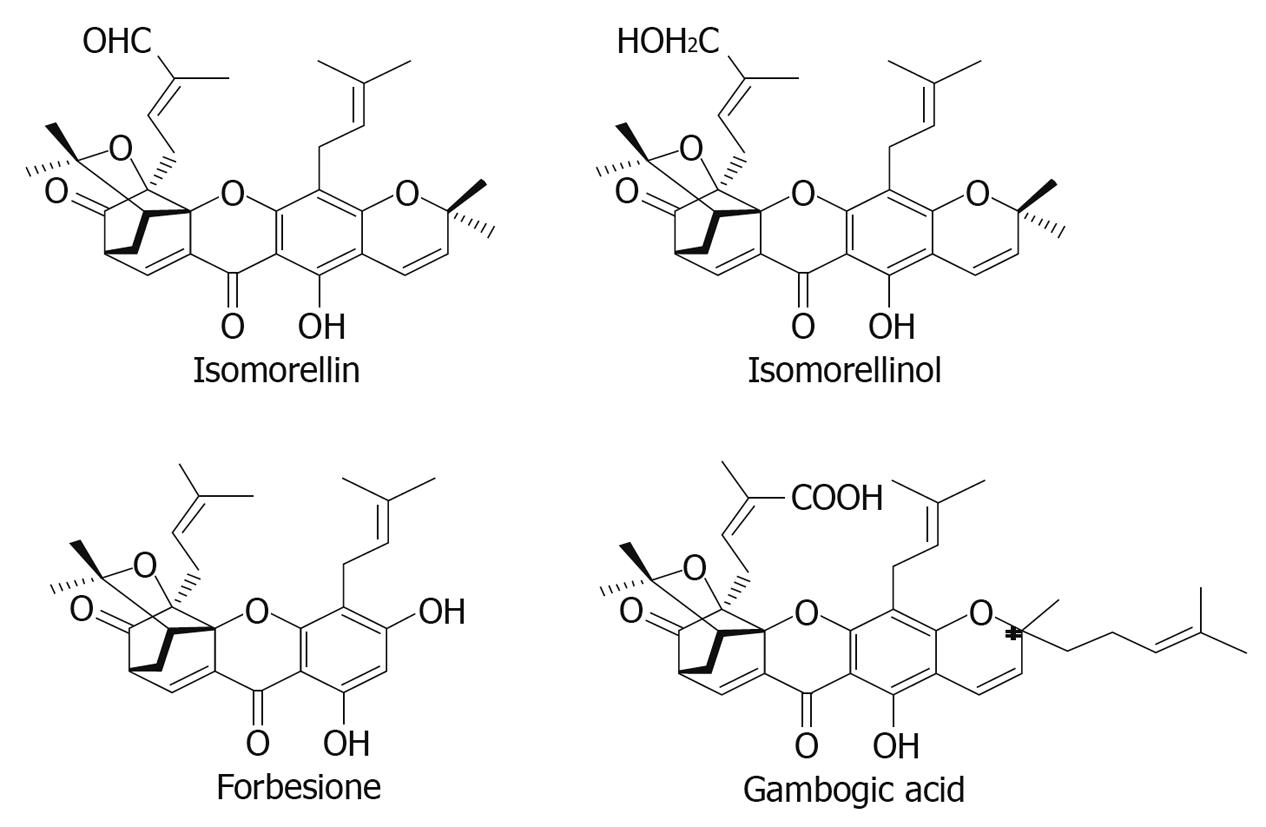
Figure 1 Chemical structure of four caged xanthones.
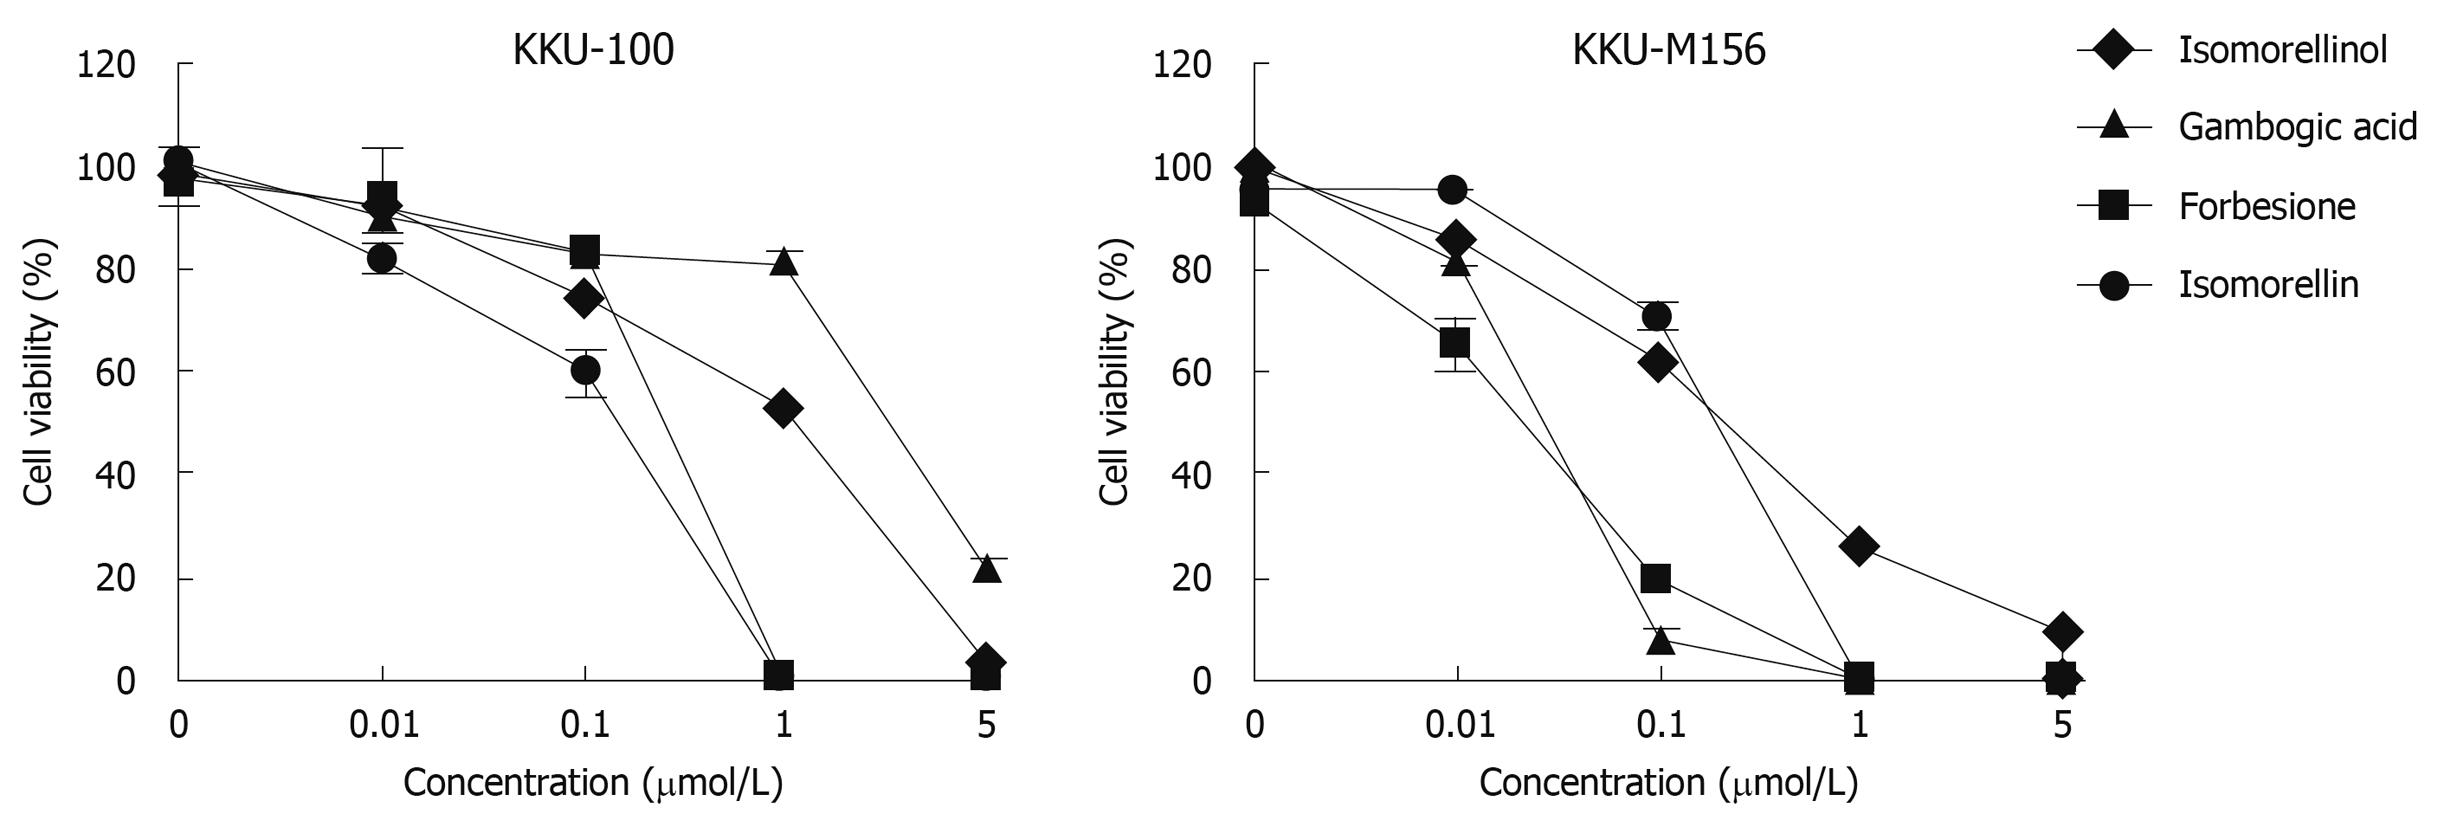
Figure 2 Antiproliferative activities of the four caged xanthones against KKU-100 and KKU-M156 cells.
Cells were treated with DMSO or indicated amounts of isomorellinol, forbesione, gambogic acid and isomorellin for 72 h. The percent cell viability was determined by SRB assay. Data are expressed as mean ± SE (n = 3).
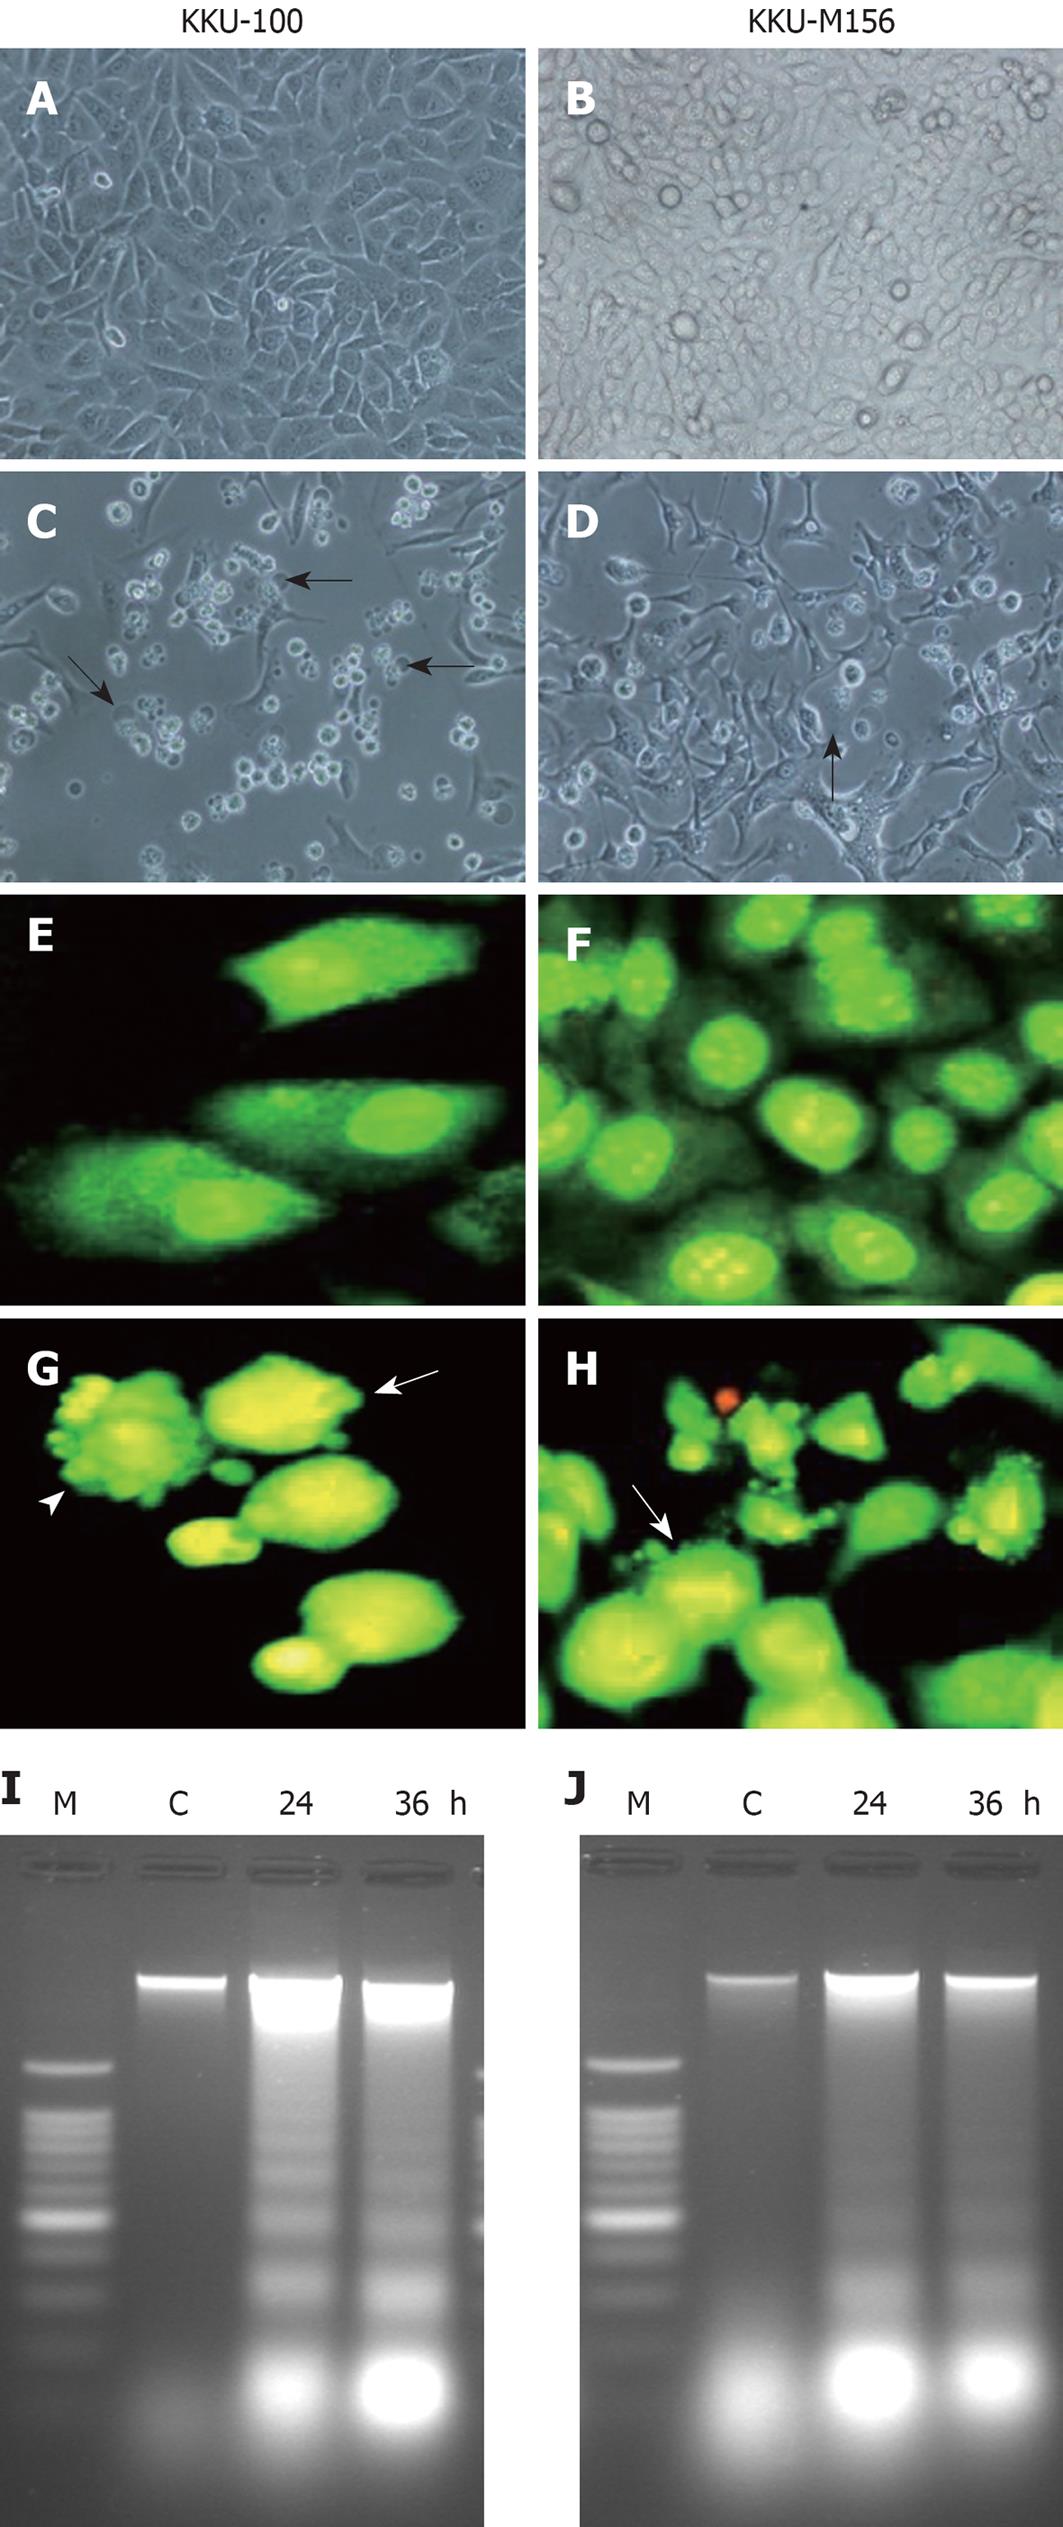
Figure 3 Induction of apoptosis in cholangiocarcinoma (CCA) cell lines by four caged xanthones.
Photomicrographs (400 ×) of CCA cell lines KKU-100 (A, C) and KKU-M156 (B, D) treated with DMSO and gambogic acid for 48 h. A, B: Treated with DMSO; C, D: Treated with gambogic acid. Cells with membrane blebbing indicated by arrows; Fluorescence photomicrographs (400 ×) of CCA cell lines KKU-100 (E, G) and KKU-M156 (F, H) treated with DMSO and isomorellinol for 36 h followed by EB/AO staining. E, F: Treated with DMSO; G, H: Treated with isomorellinol. Nuclei of treated cells showing chromatin condensation (arrows) and nuclear fragmentation (arrow heads); DNA fragmentation of CCA cell lines treated with forbesione for the indicated times (24 h and 36 h). Genomic DNA was isolated and separated on 1.6% agarose gels containing 0.1 mg/mL ethidium bromide. I: KKU-100 cells; J: KKU-M156 cells. Lane C: DNA band of CCA cell lines treated with DMSO; Lane M: DNA markers. The figures show representative results of three independent experiments.
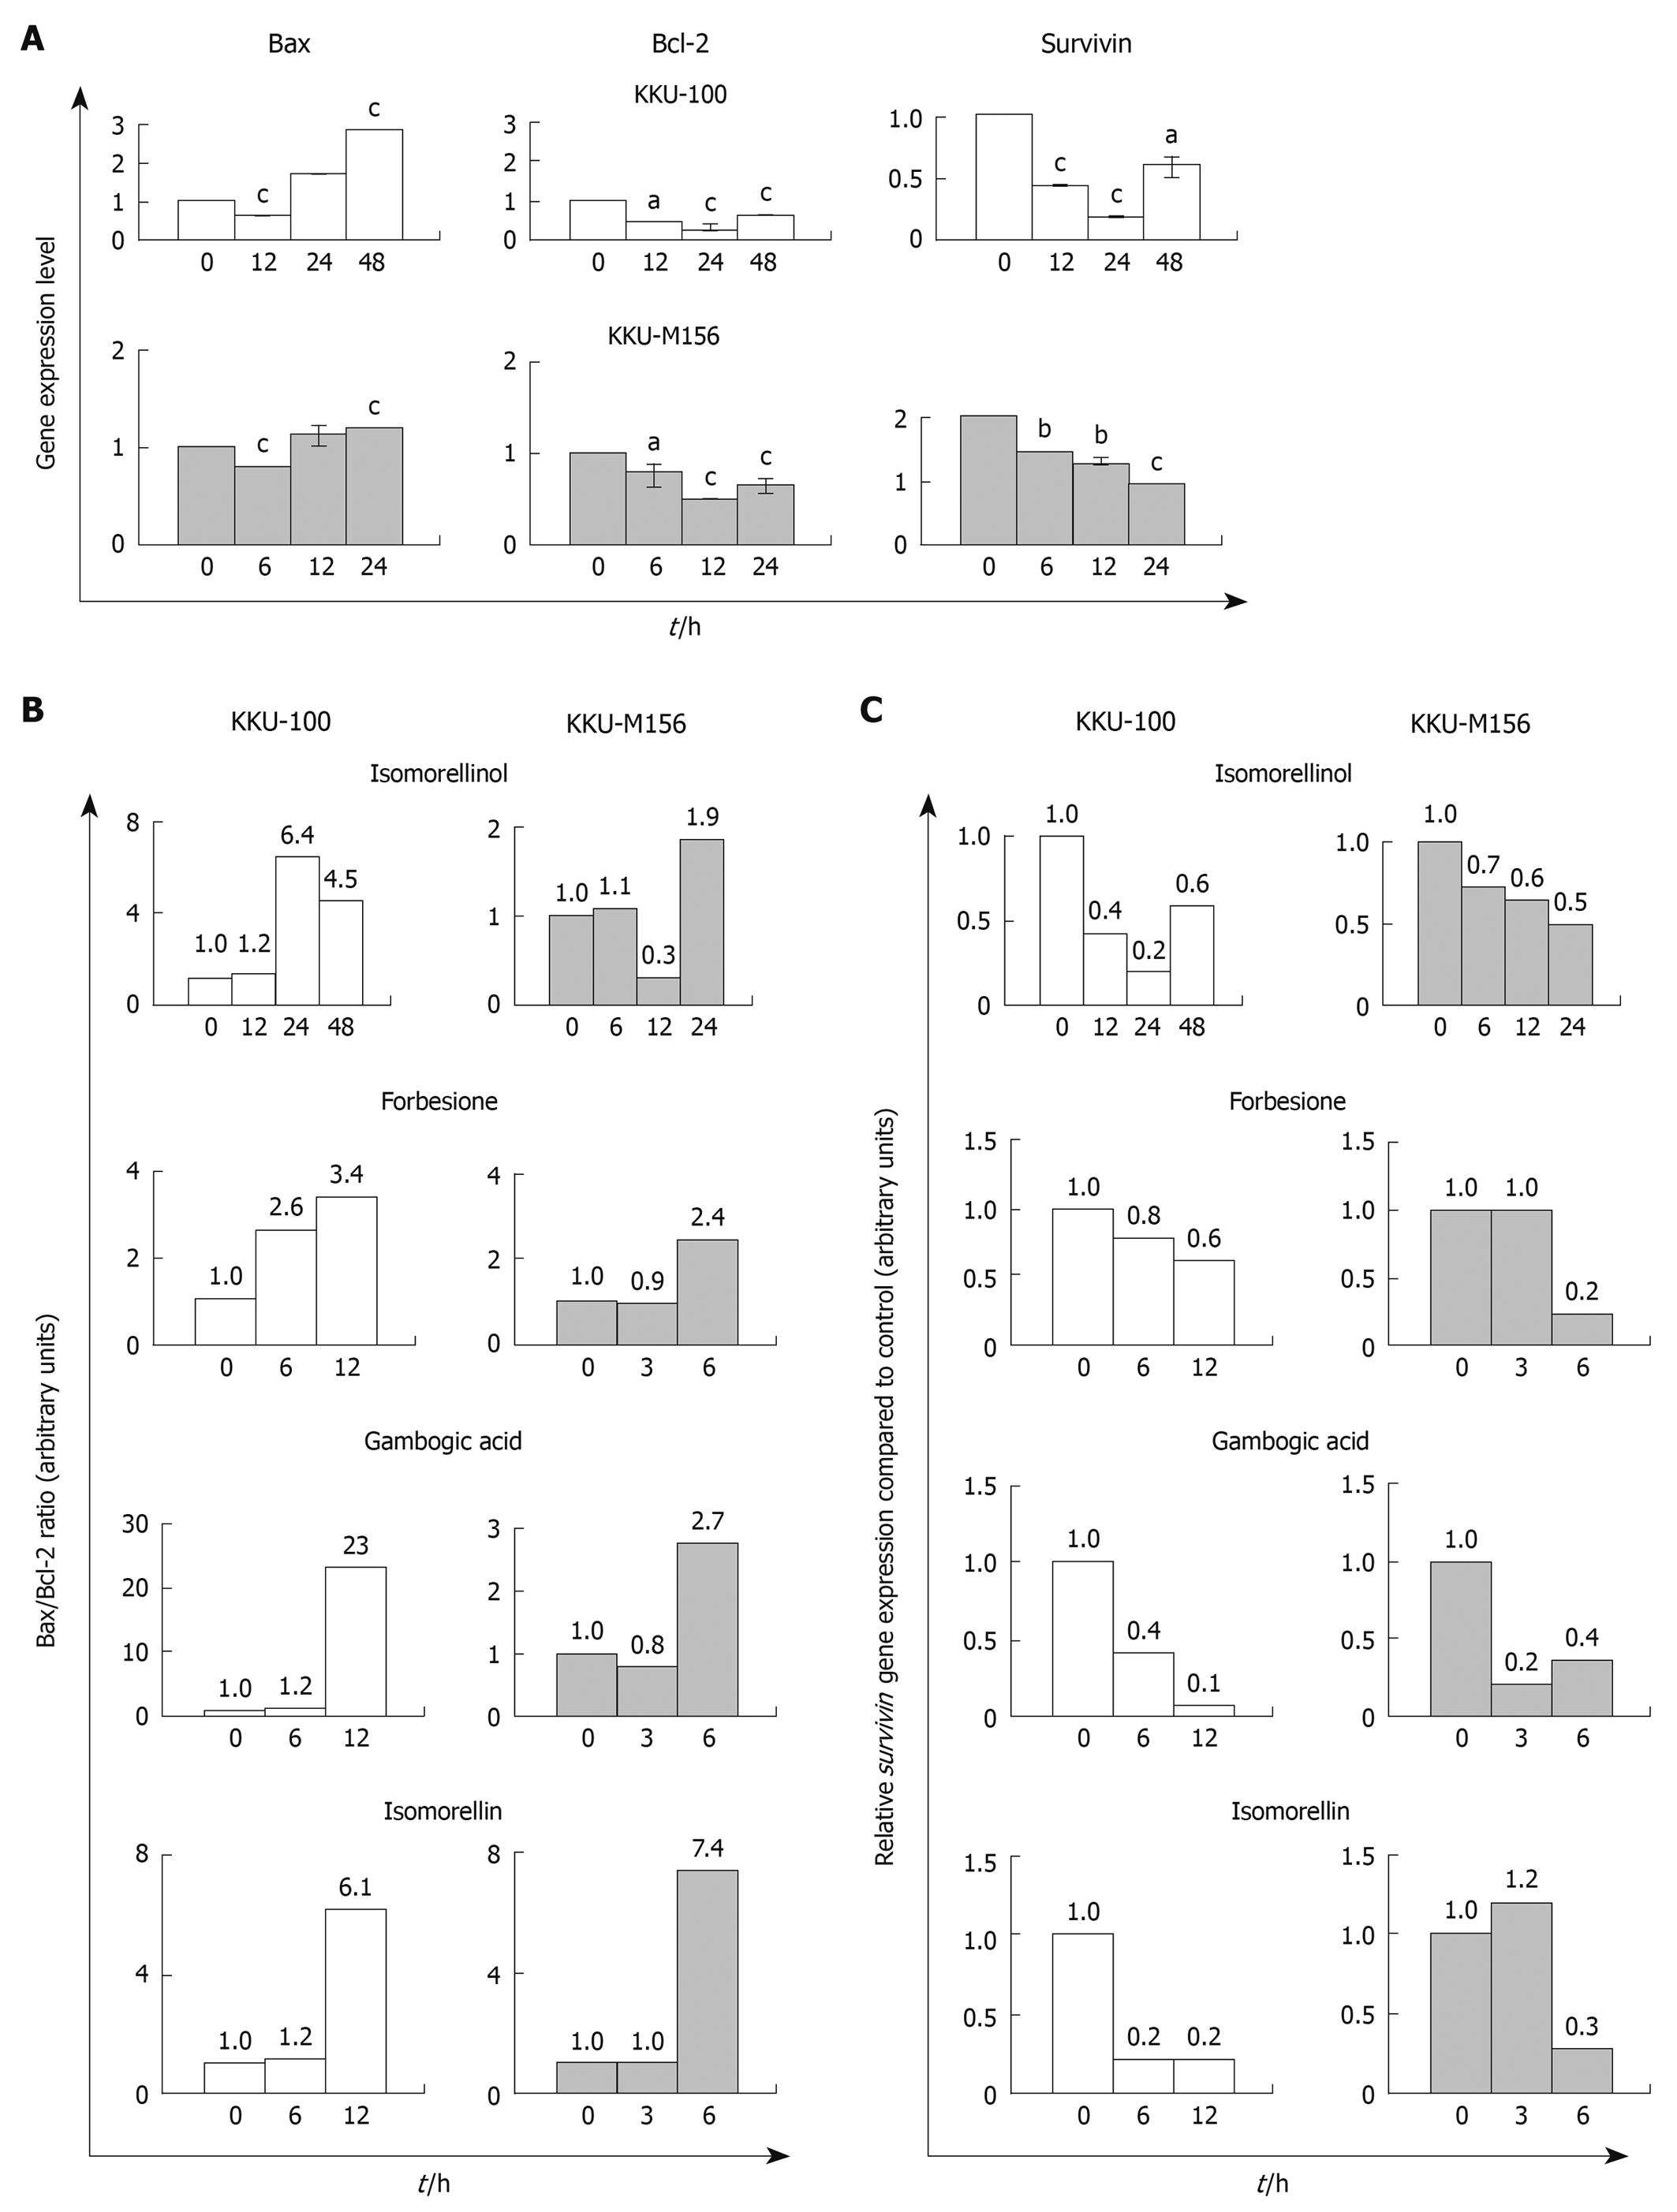
Figure 4 The four caged xanthones induce up-regulation of Bax with down-regulation of Bcl-2 and survivin gene expressions in CCA cell lines.
KKU-100 and KKU-M156 cells were treated with DMSO or the four caged xanthones for the indicated times. Real-time polymerase chain reaction for each gene was performed as described in Materials and Methods. Data were expressed as mean ± SE fold increase/decrease in mRNA expression compared to control, normalized with GAPDH (n = 3). aP < 0.05, bP < 0.01, cP < 0.001 vs control. All four compounds showed the same result. A: The histograms of the isomorellinol-treated cells were used as a representative; B: Bax/Bcl-2 ratio; C: Relative survivin gene expression compared to control.
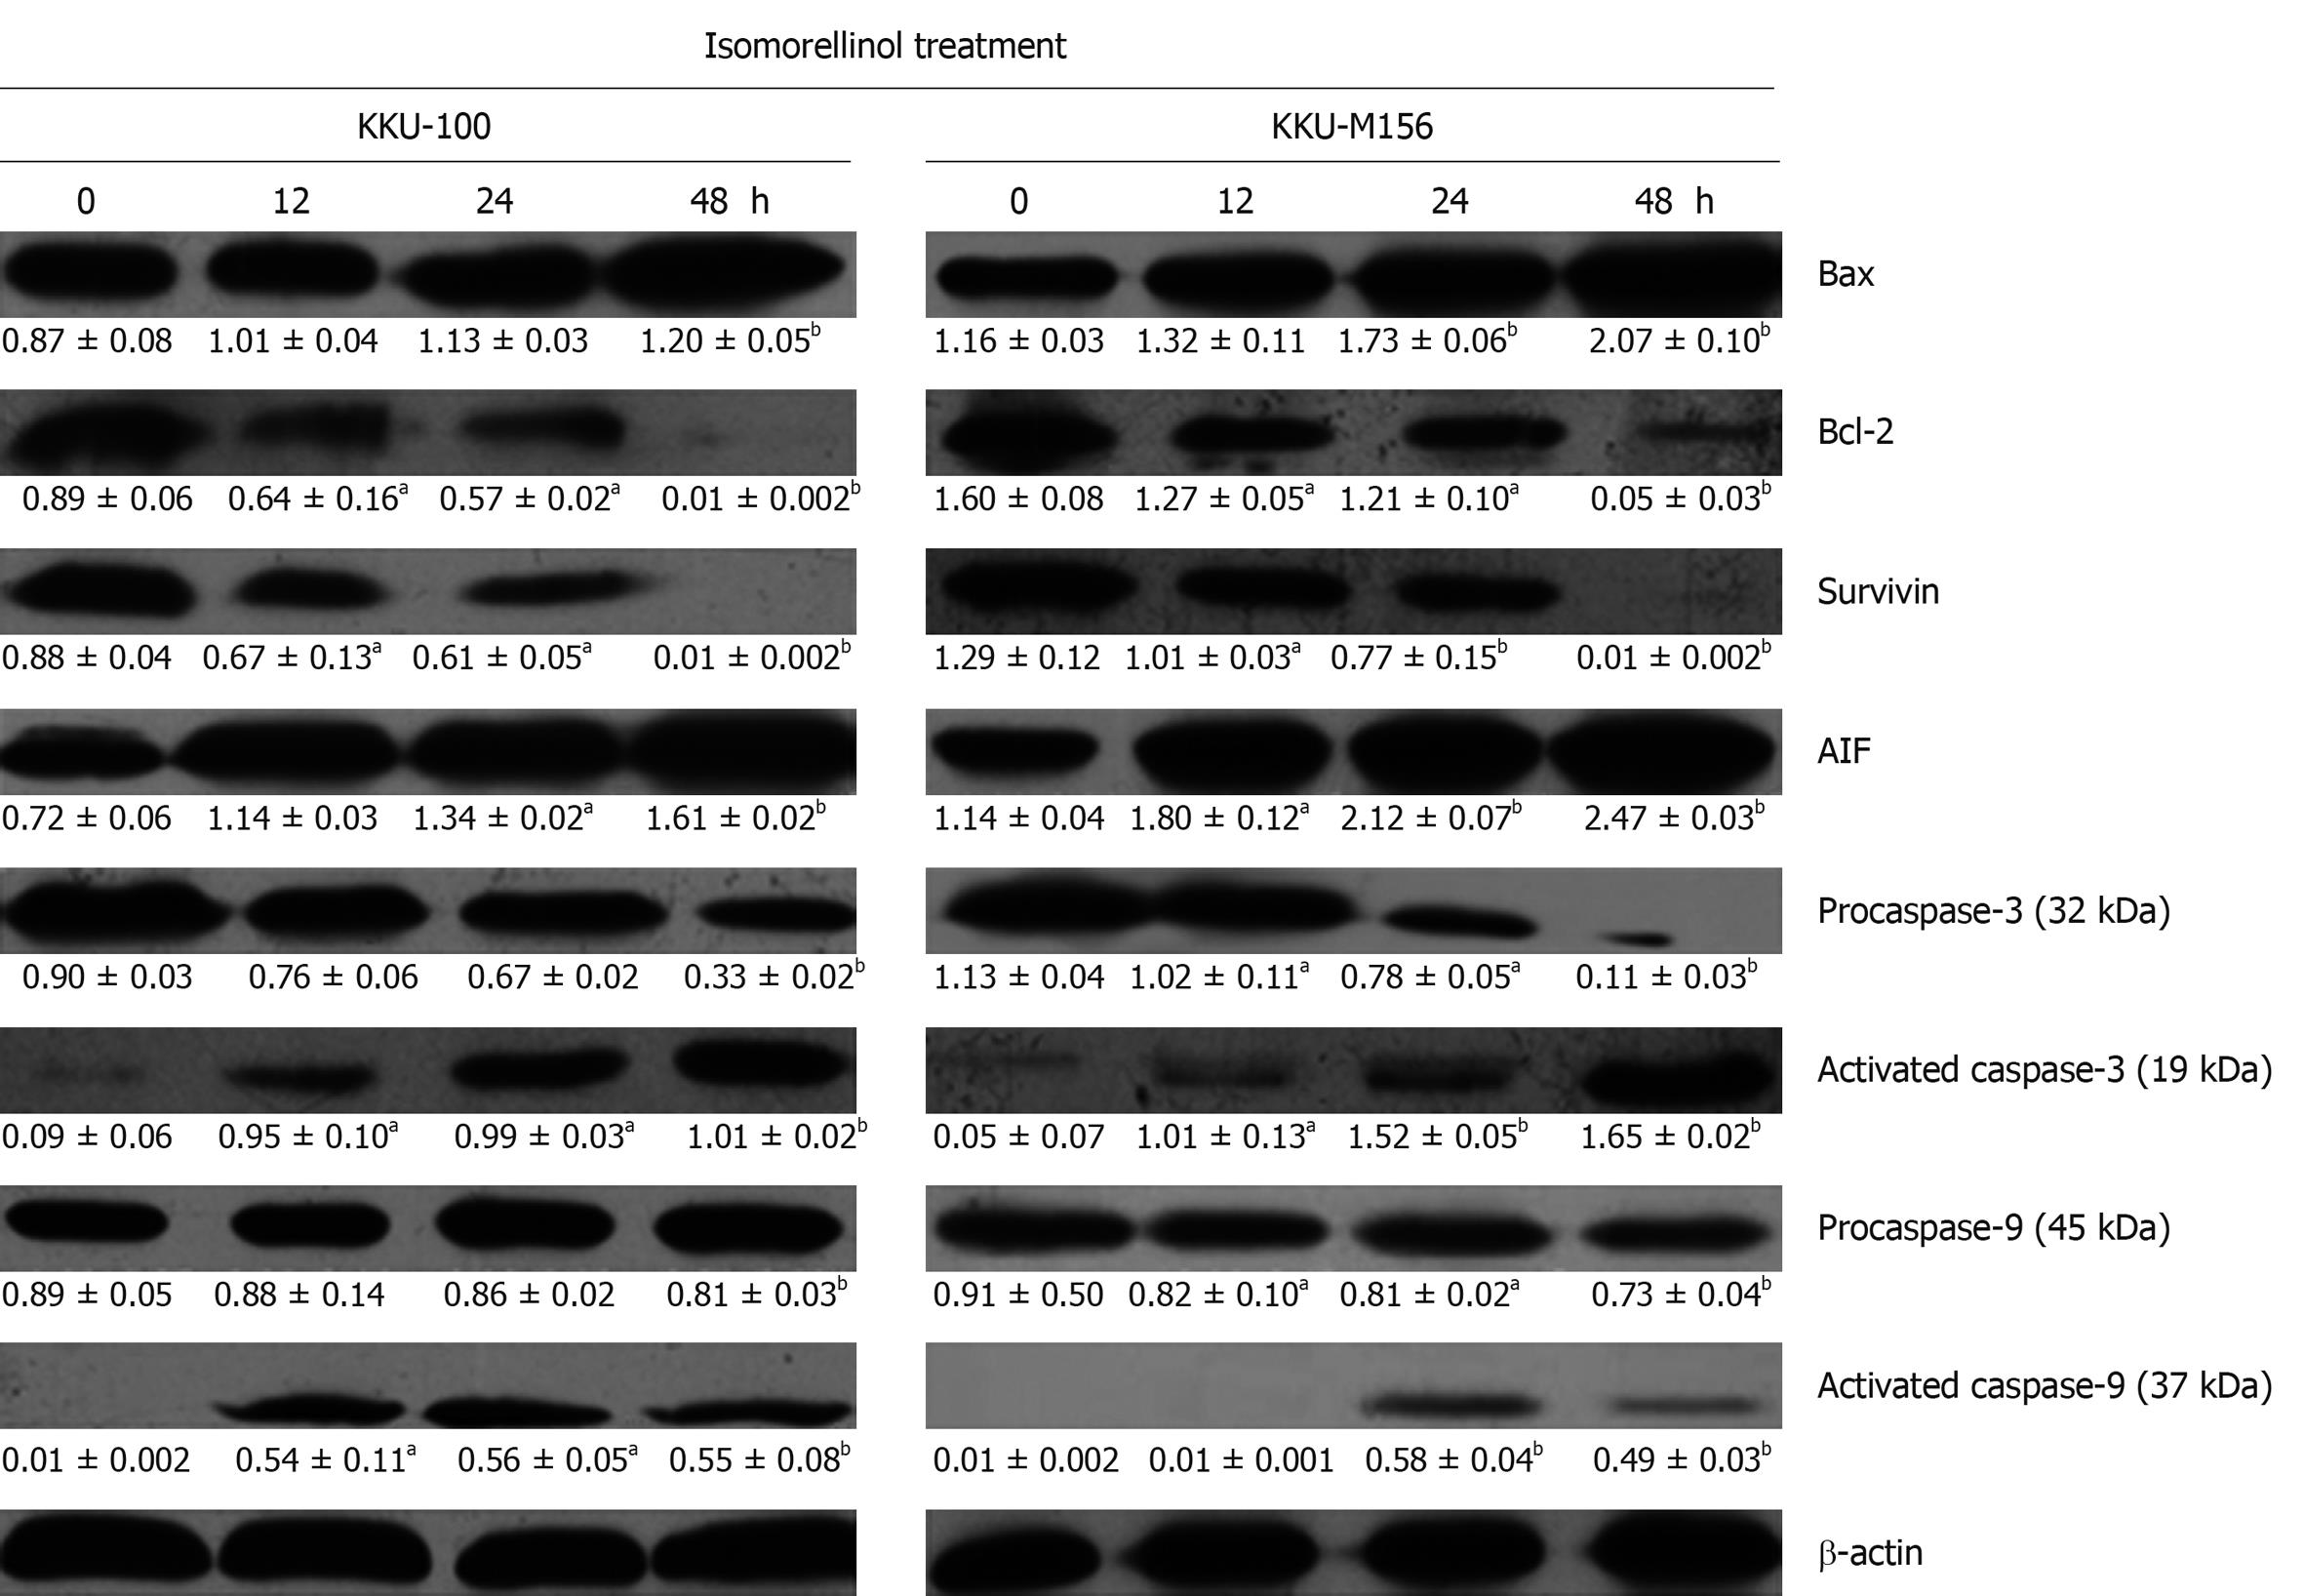
Figure 5 The four caged xanthones induce increase of Bax, AIF, activated caspase-3 and -9 while decreasing Bcl-2, survivin, procaspase-3 and -9 protein levels in CCA cell lines.
KKU-100 and KKU-M156 cell lines were treated with DMSO or the four caged xanthones for the indicated times. Western blottings for each protein were performed as described in Materials and Methods. The mean ± SE of density reading of target protein normalized to β-actin was expressed in the respective box (n = 3). aP < 0.05, bP < 0.01 vs control. All four compounds showed the same result. The protein bands of the isomorellinol-treated cells were used as a representative.
-
Citation: Hahnvajanawong C, Boonyanugomol W, Nasomyon T, Loilome W, Namwat N, Anantachoke N, Tassaneeyakul W, Sripa B, Namwat W, Reutrakul V. Apoptotic activity of caged xanthones from
Garcinia hanburyi in cholangiocarcinoma cell lines. World J Gastroenterol 2010; 16(18): 2235-2243 - URL: https://www.wjgnet.com/1007-9327/full/v16/i18/2235.htm
- DOI: https://dx.doi.org/10.3748/wjg.v16.i18.2235


