Copyright
©2010 Baishideng.
World J Gastroenterol. May 14, 2010; 16(18): 2227-2234
Published online May 14, 2010. doi: 10.3748/wjg.v16.i18.2227
Published online May 14, 2010. doi: 10.3748/wjg.v16.i18.2227
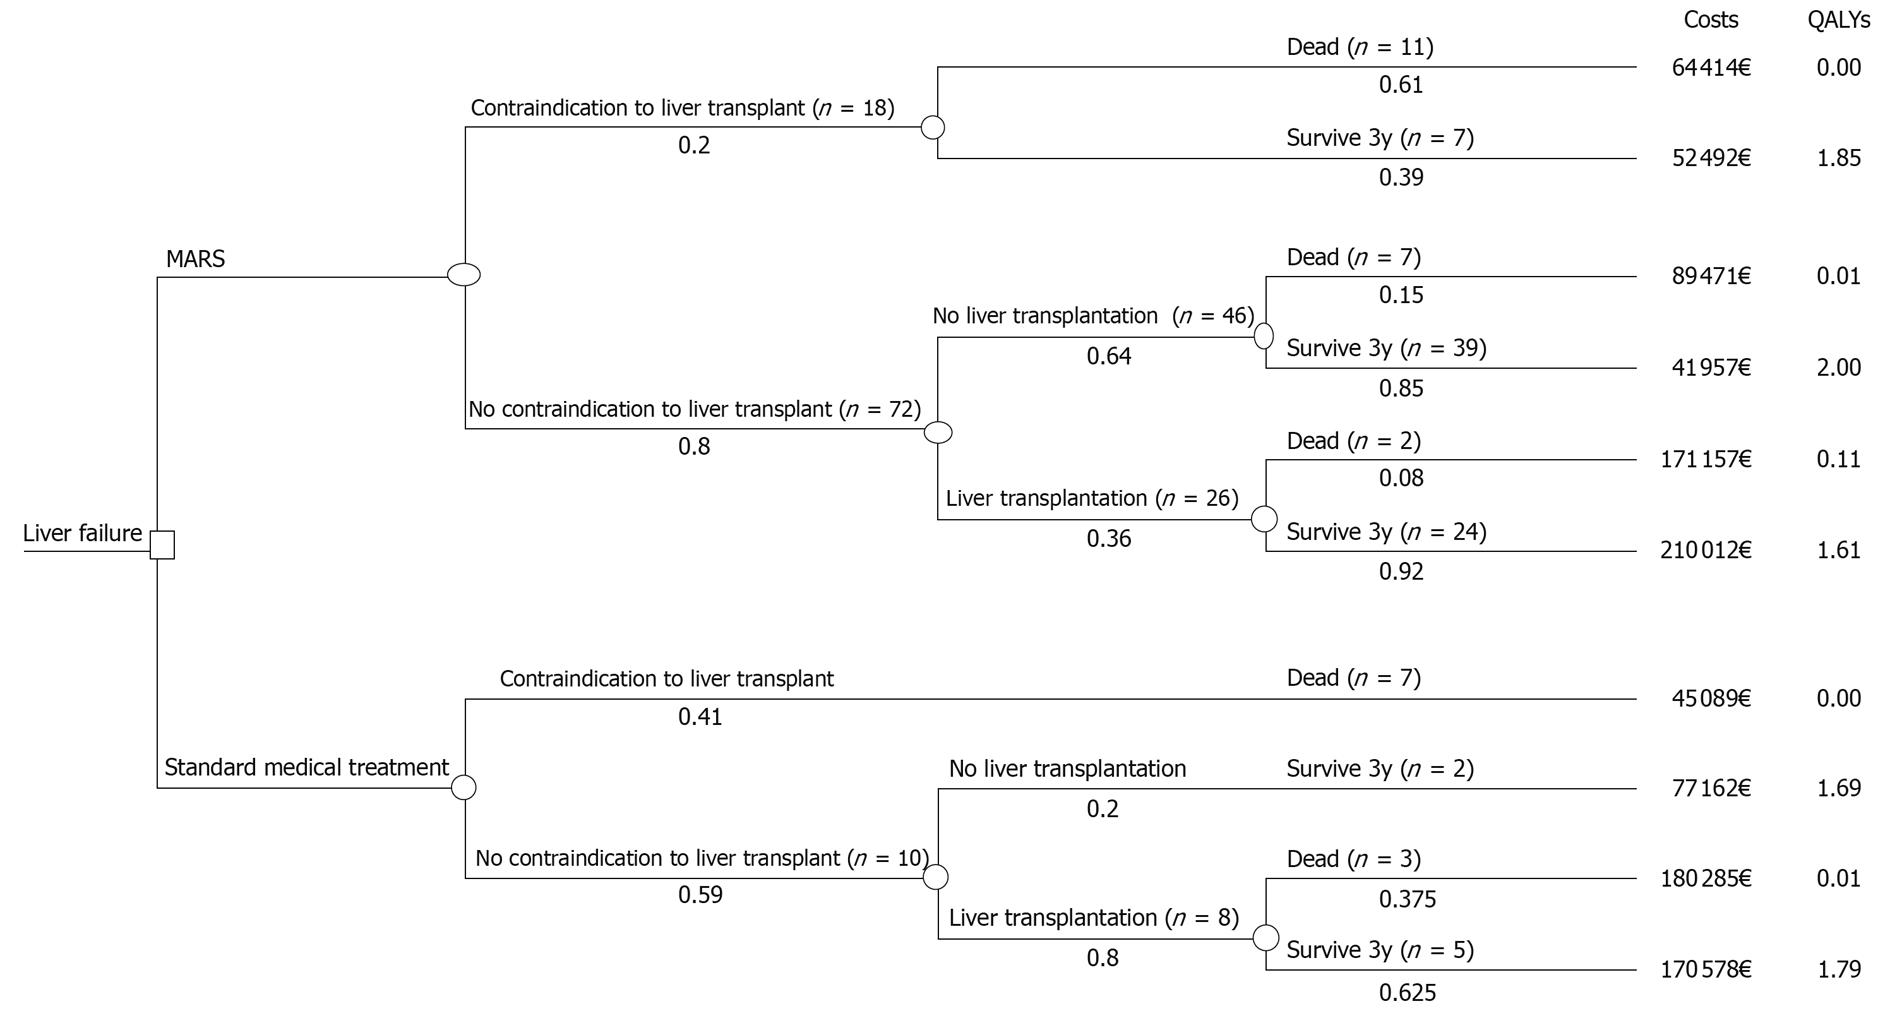
Figure 1 A deterministic decision model.
In both treatment arms, the patient cohort was divided based on contraindication vs no contraindication to liver transplantation (Ltx) and then on the basis of Ltx vs no-Ltx. The “survive 3y” branches include all patients who survived at least three years after the first treatment, and the “death” branches include all patients who died within those three years. The pathway probabilities i.e. the proportion of the cohort that is expected to experience the event, are shown under each branch and were calculated based on real patient data. MARS: Molecular adsorbent recirculating system; QALY: Quality-adjusted life year.
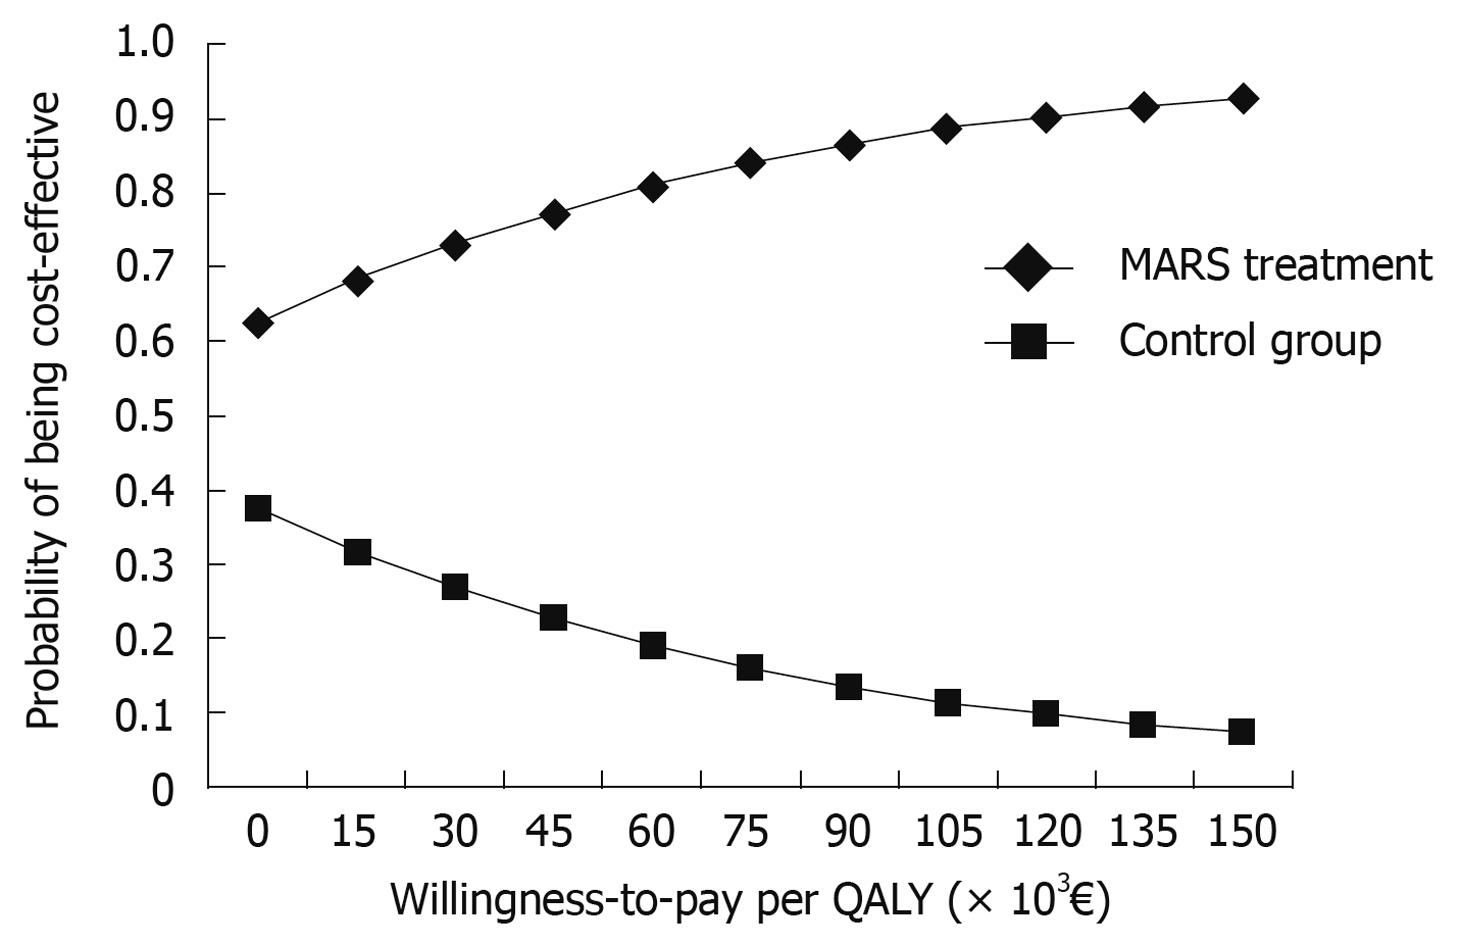
Figure 2 The cost-effectiveness acceptability curve for MARS vs standard medical therapy in the historical control group in acute liver failure.
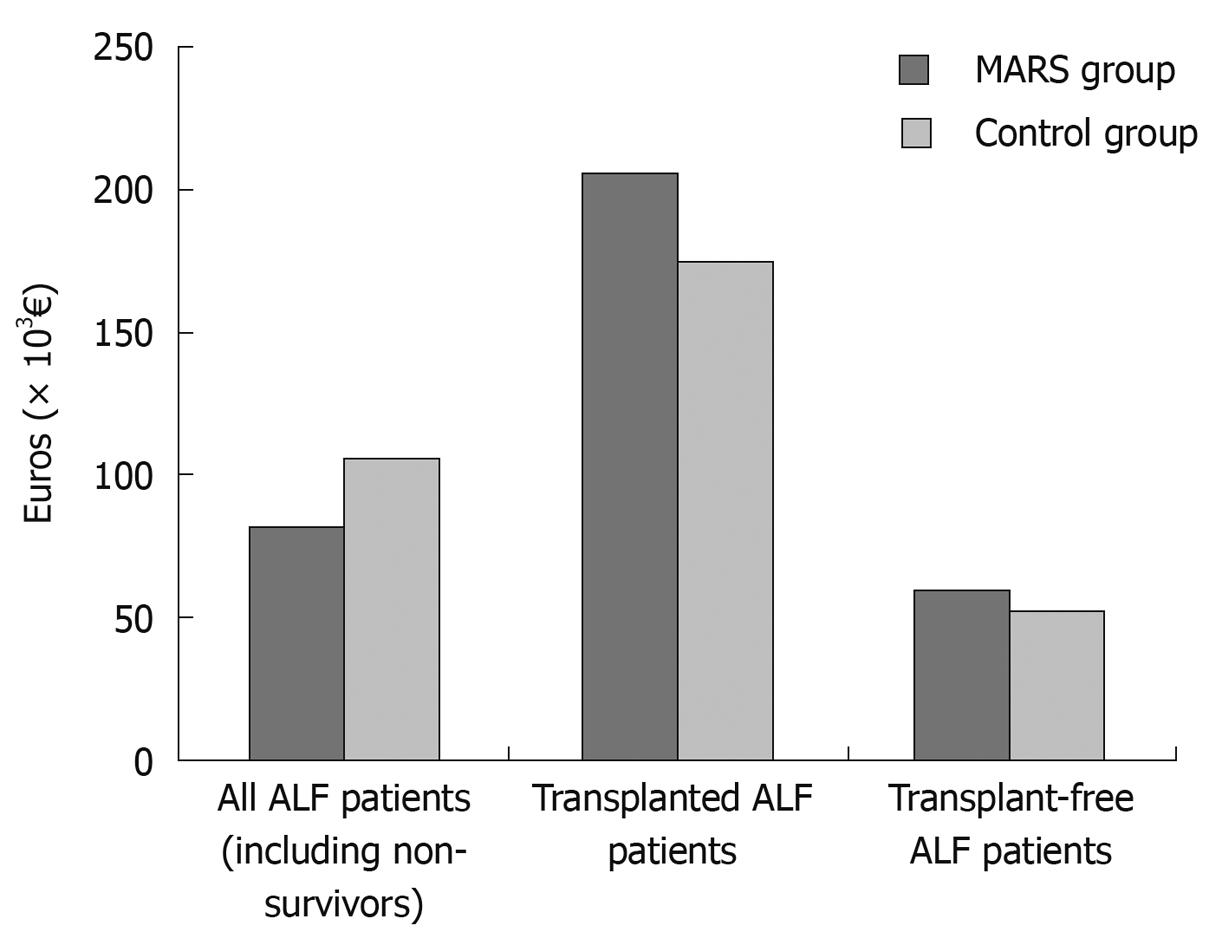
Figure 3 The 3.
5-year mean overall direct medical costs per patient in the MARS and control groups. ALF: Acute liver failure.
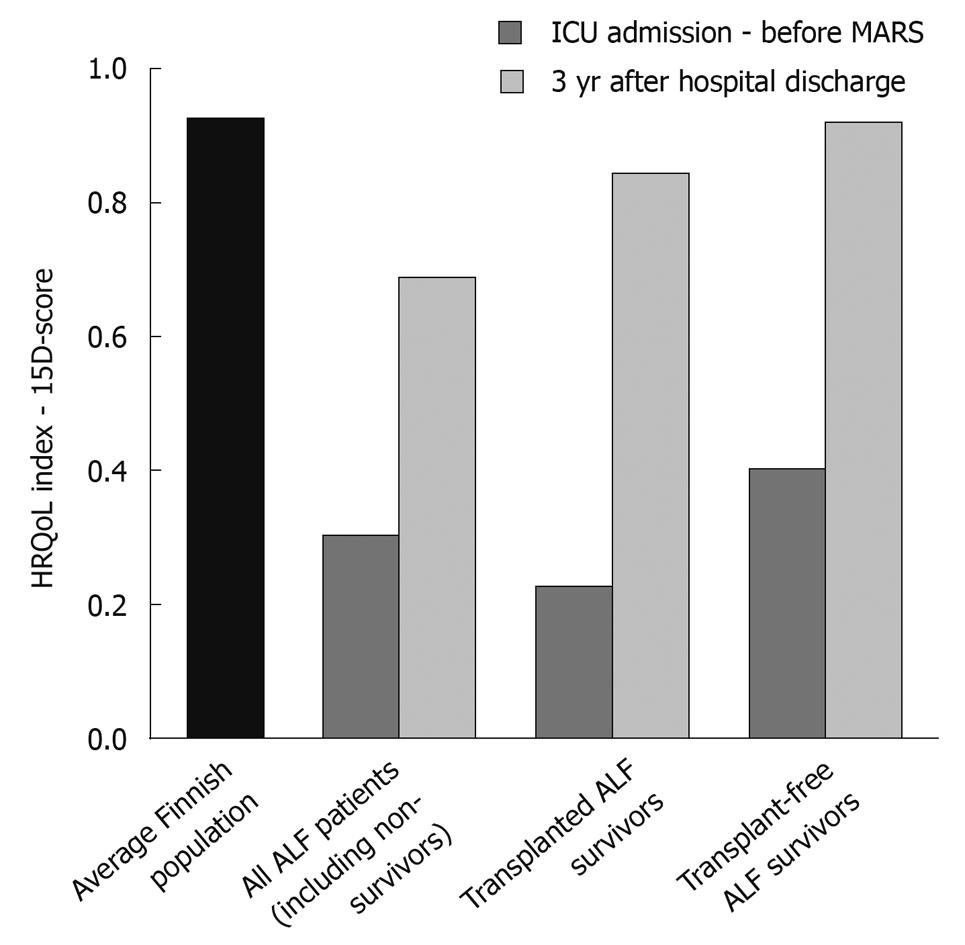
Figure 4 The 15D-score before and 3 years after MARS treatment.
HRQoL: Health-related quality of life.
- Citation: Kantola T, Mäklin S, Koivusalo AM, Räsänen P, Rissanen A, Roine R, Sintonen H, Höckerstedt K, Isoniemi H. Cost-utility of molecular adsorbent recirculating system treatment in acute liver failure. World J Gastroenterol 2010; 16(18): 2227-2234
- URL: https://www.wjgnet.com/1007-9327/full/v16/i18/2227.htm
- DOI: https://dx.doi.org/10.3748/wjg.v16.i18.2227


