Copyright
©2010 Baishideng.
World J Gastroenterol. Apr 21, 2010; 16(15): 1908-1915
Published online Apr 21, 2010. doi: 10.3748/wjg.v16.i15.1908
Published online Apr 21, 2010. doi: 10.3748/wjg.v16.i15.1908
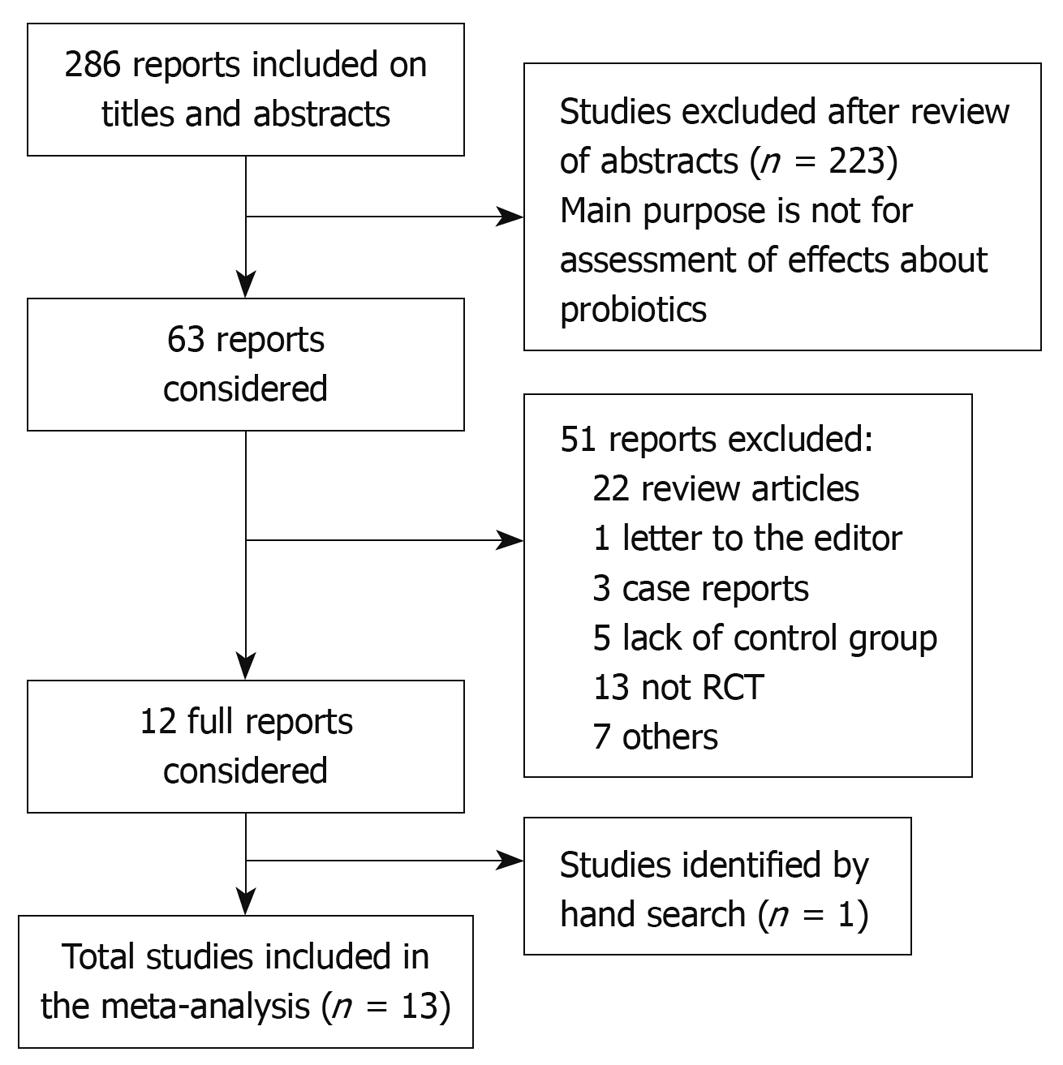
Figure 1 Study selection process.
A flowchart was present in this figure and the flowchart summarizes the selection of studies including numbers and reasons of studies excluded.
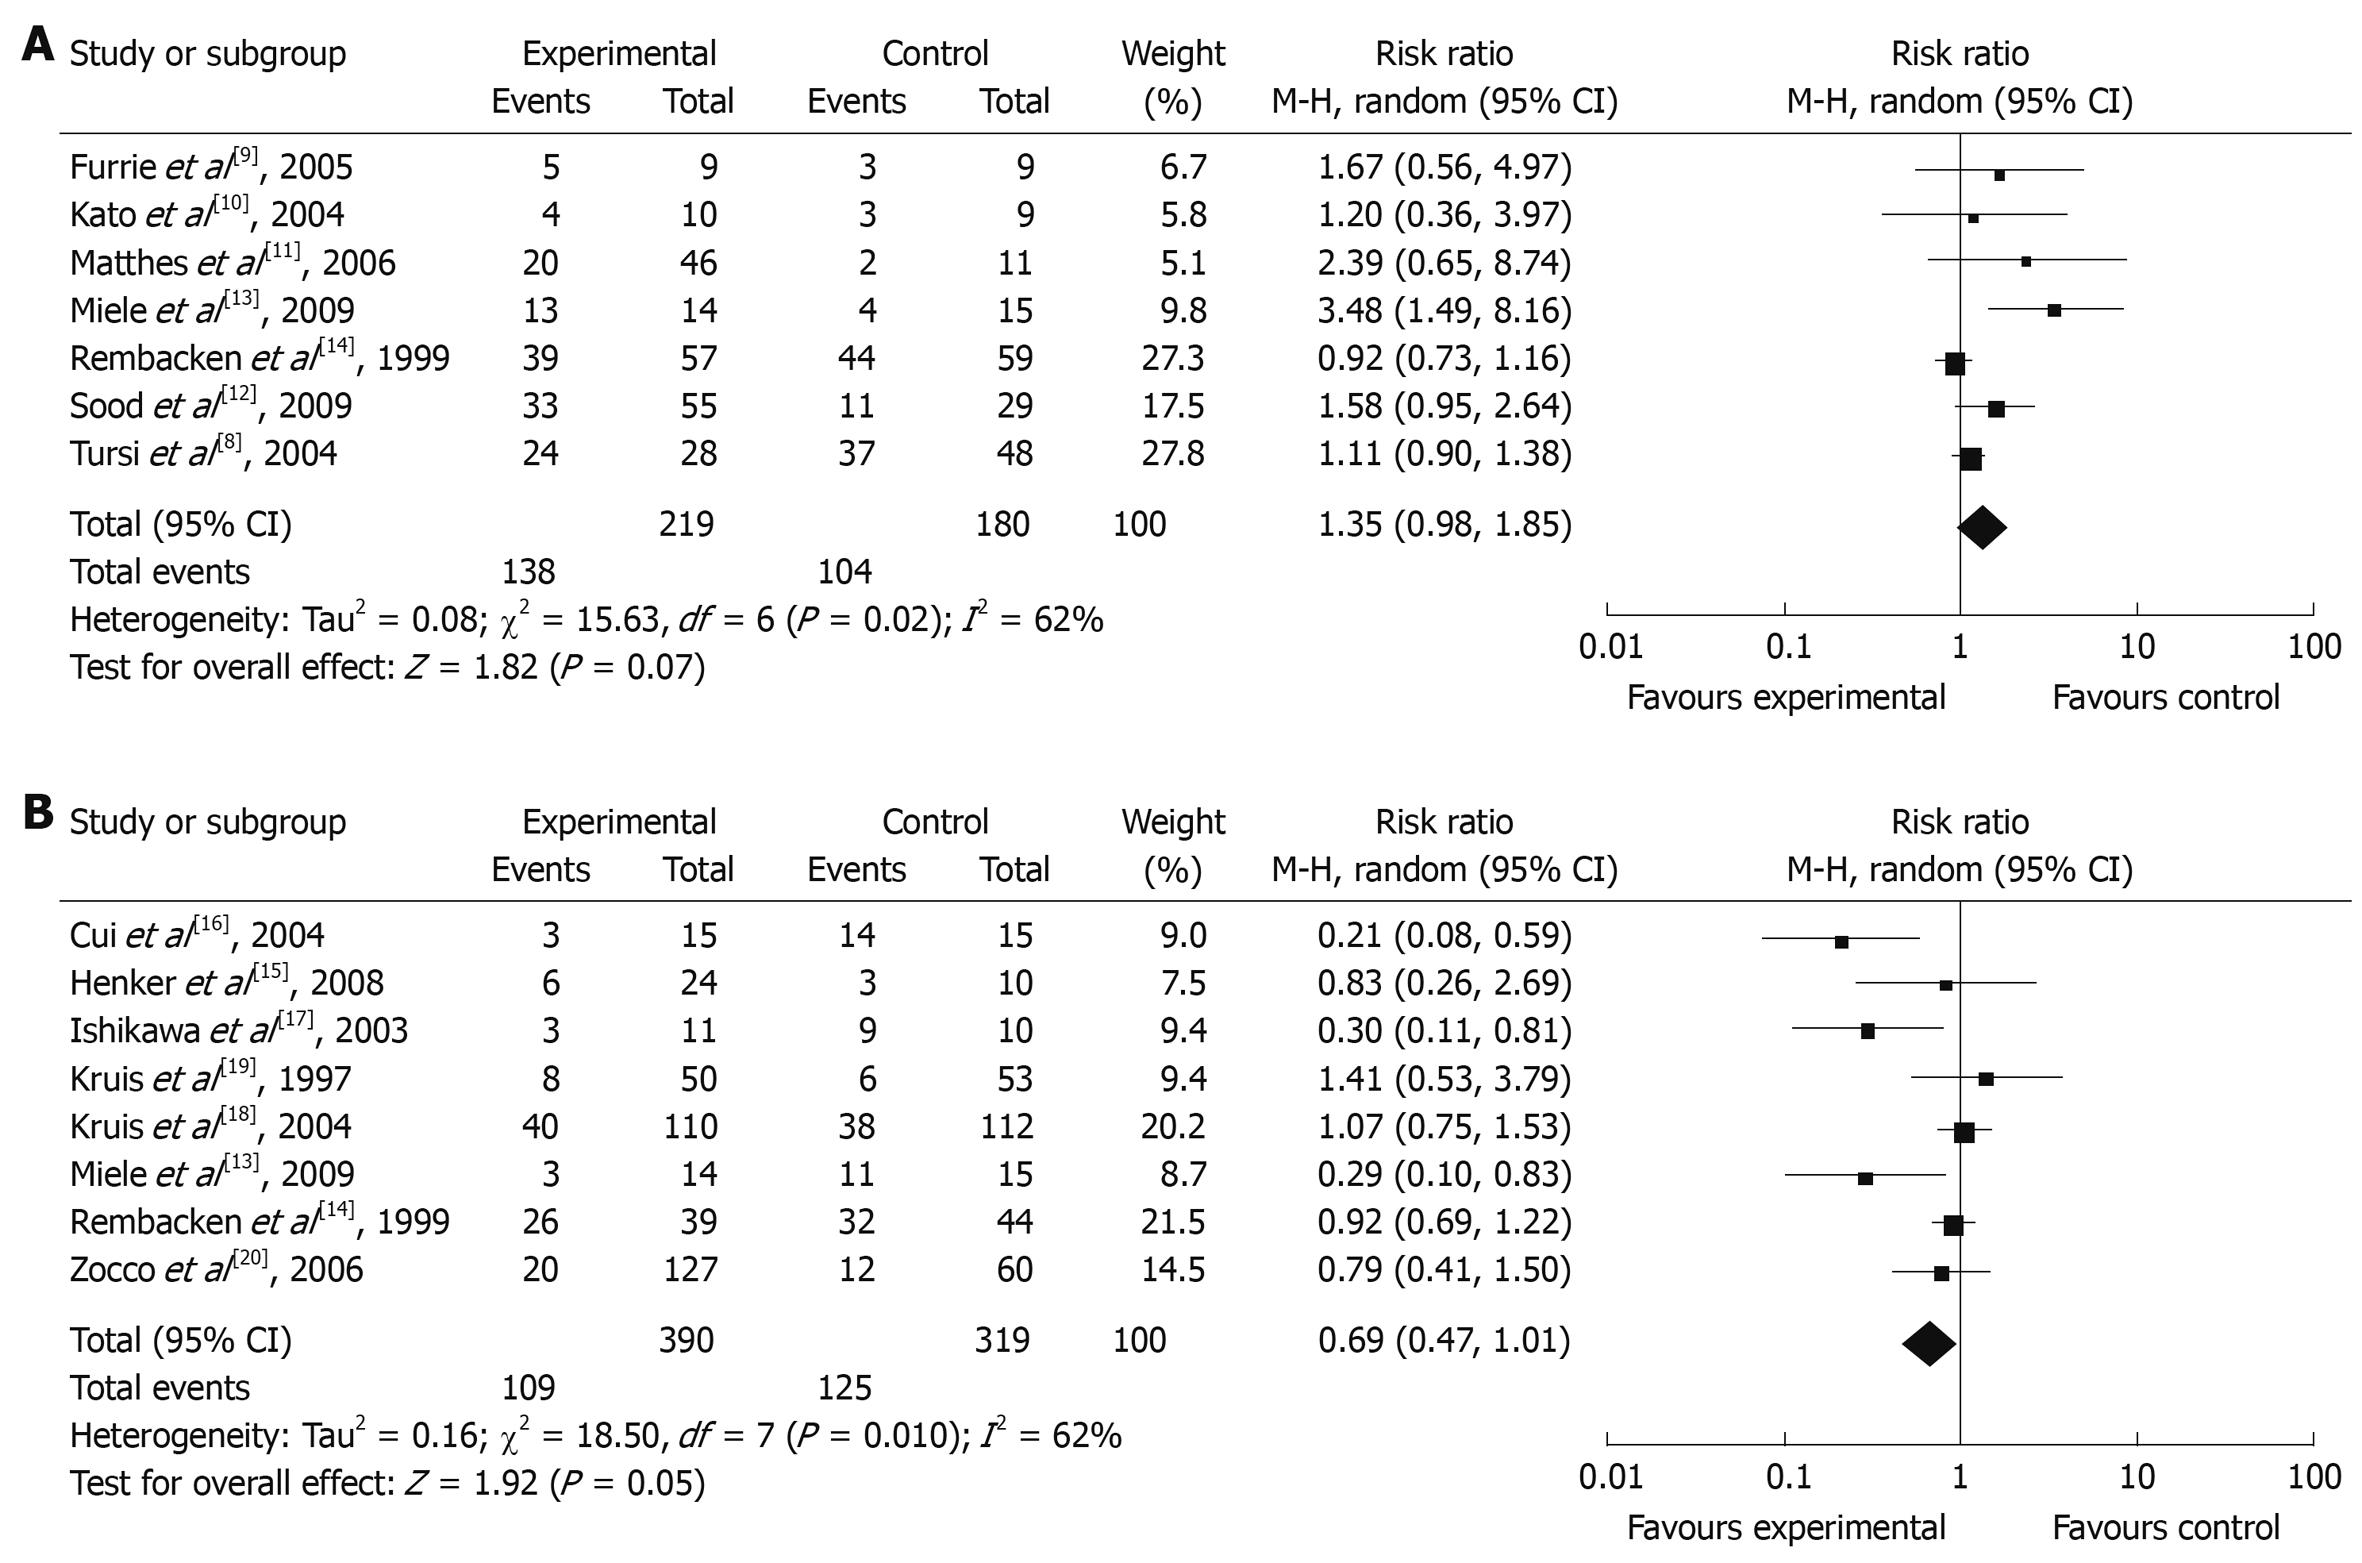
Figure 2 Remission rate (A) and relapse rate (B) of probiotic group vs control group.
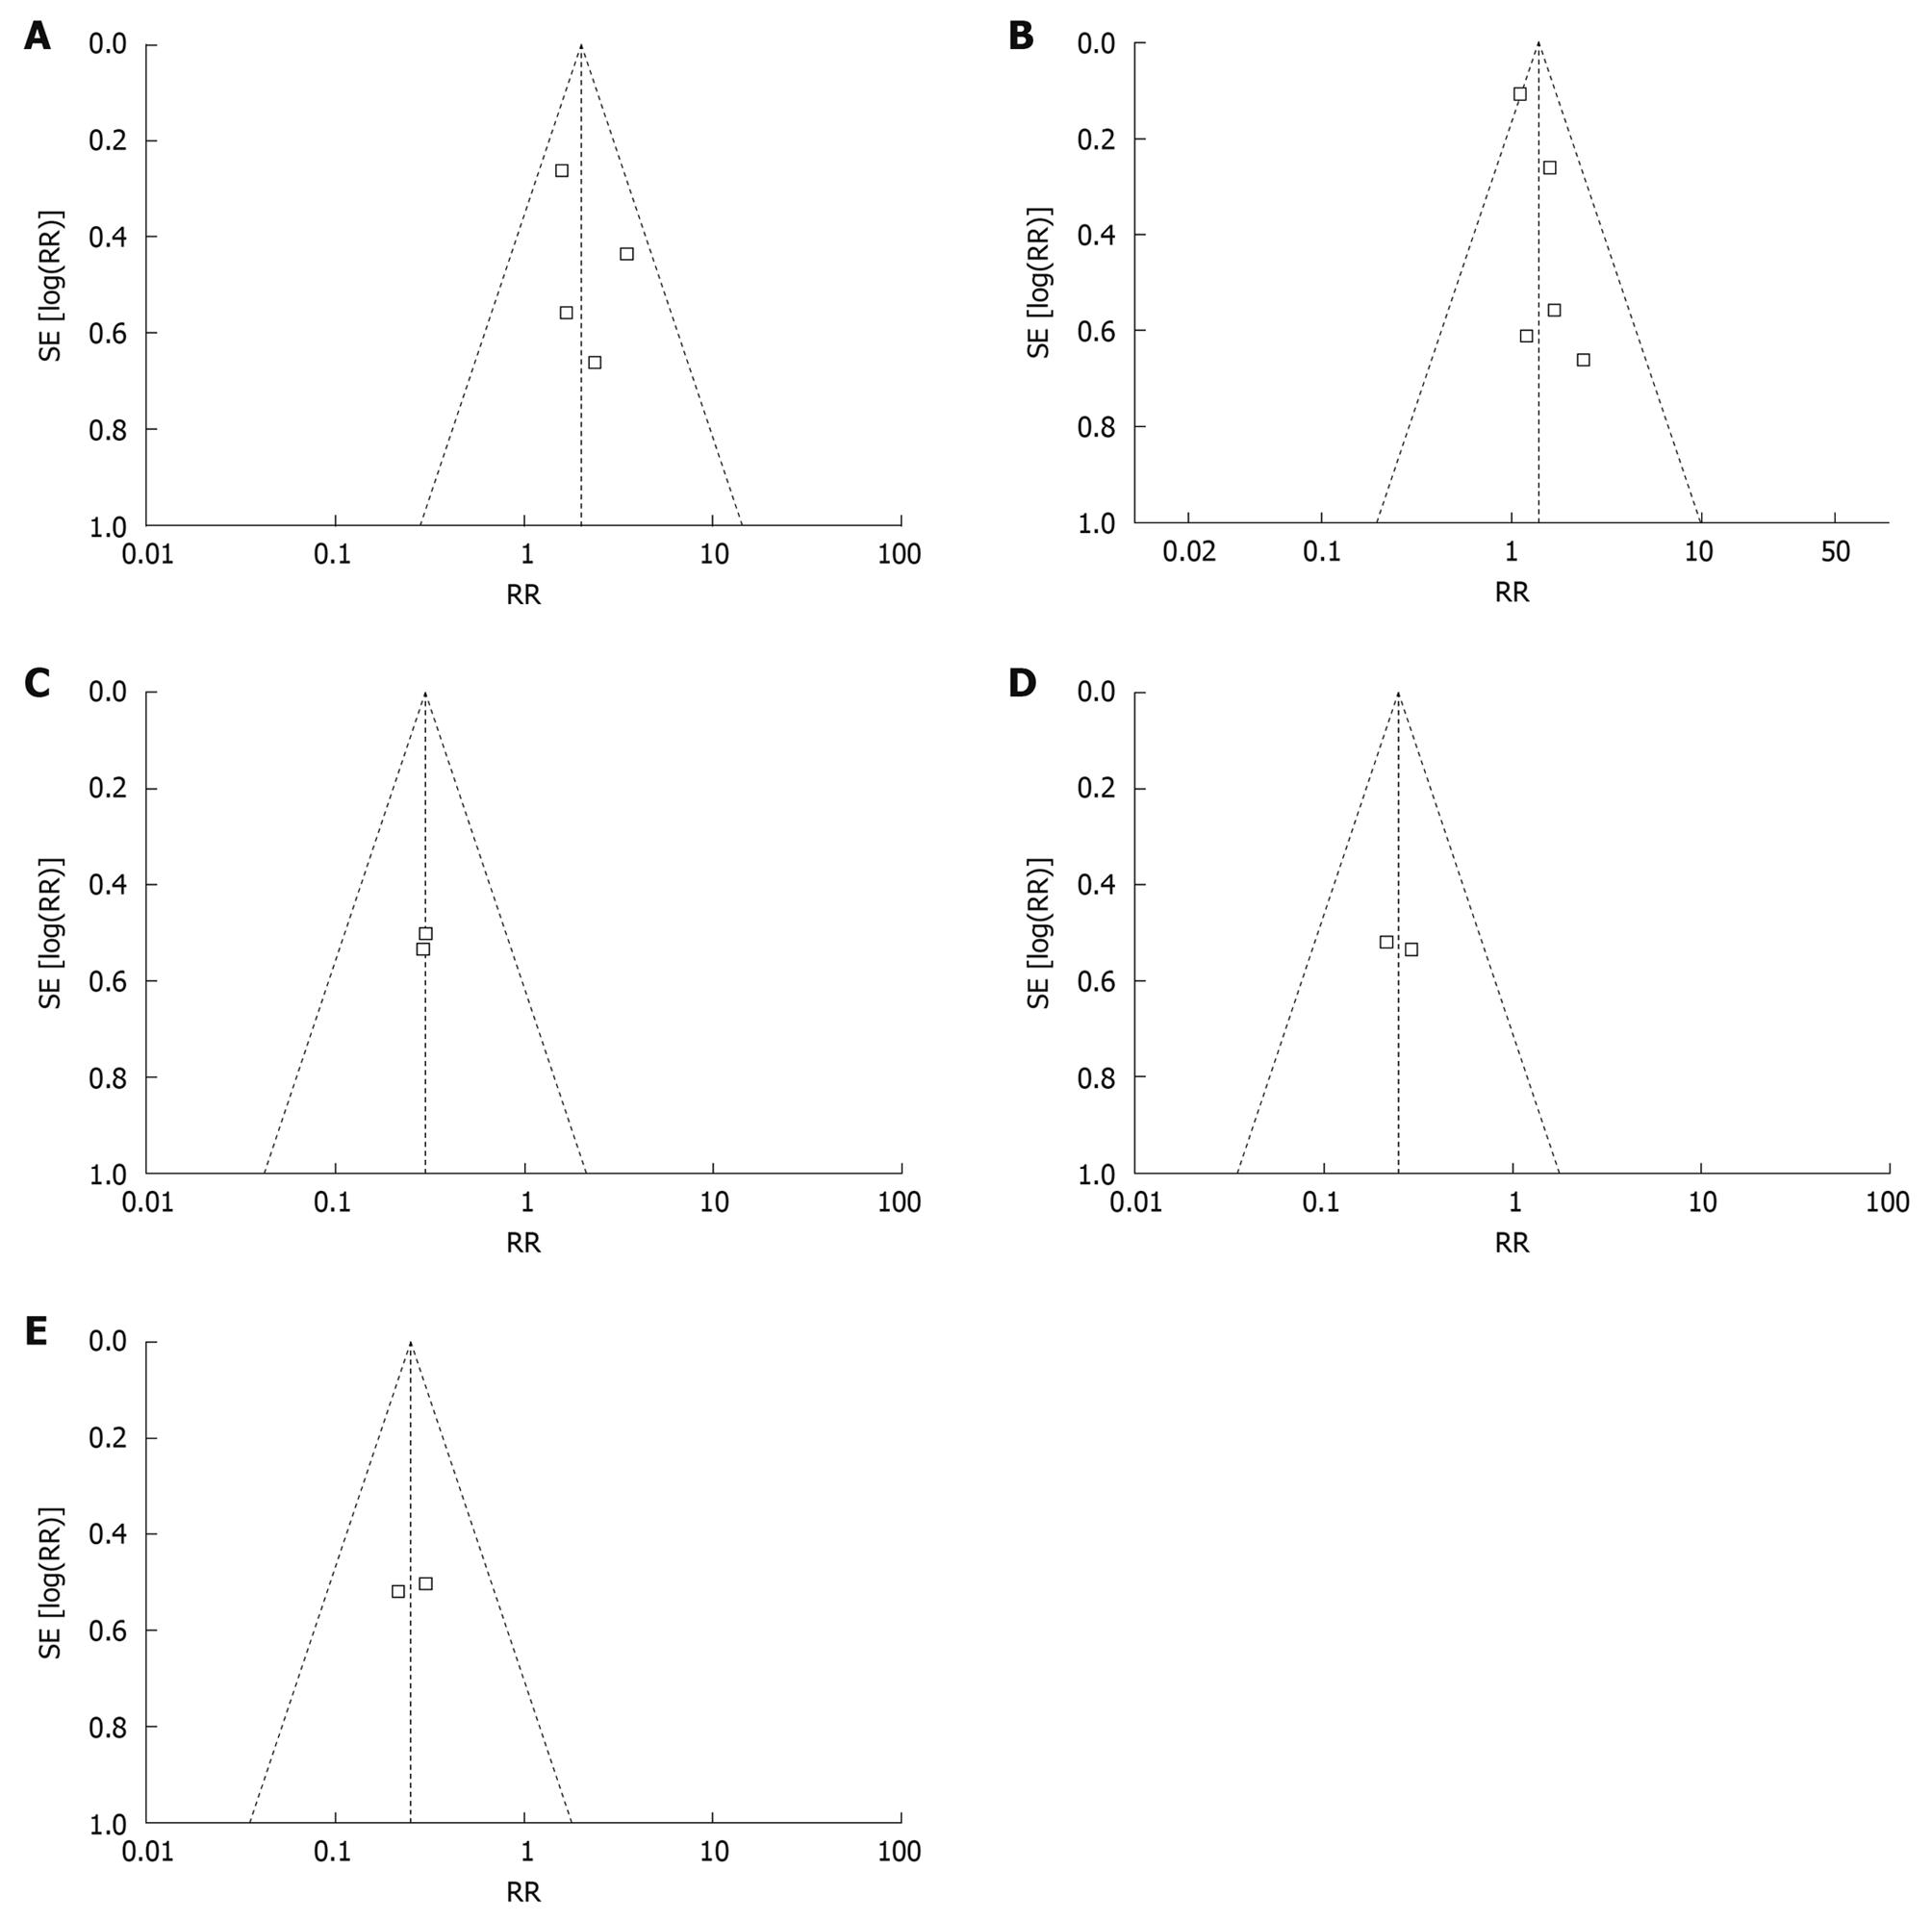
Figure 3 Inverted funnel plot analysis of the relative of remission rate.
A: Inverted funnel plot analysis of the relative of remission rate between probiotics group and placebo group; B: Less than 12 mo group: Inverted funnel plot analysis of the relative of remission rate between probiotics group and non-probiotics group; C: Mild and middle UC group: Inverted funnel plot analysis of the relative of remission rate between probiotics group and non-probiotics group; D: Inverted funnel plot analysis of the relative of remission rate between probiotics group and placebo group; E: Inverted funnel plot analysis of the relative of remission rate between Bifidobacterium longum therapy group and non-probiotics therapy group.
- Citation: Sang LX, Chang B, Zhang WL, Wu XM, Li XH, Jiang M. Remission induction and maintenance effect of probiotics on ulcerative colitis: A meta-analysis. World J Gastroenterol 2010; 16(15): 1908-1915
- URL: https://www.wjgnet.com/1007-9327/full/v16/i15/1908.htm
- DOI: https://dx.doi.org/10.3748/wjg.v16.i15.1908


