Copyright
©2009 The WJG Press and Baishideng.
World J Gastroenterol. Feb 28, 2009; 15(8): 907-911
Published online Feb 28, 2009. doi: 10.3748/wjg.15.907
Published online Feb 28, 2009. doi: 10.3748/wjg.15.907
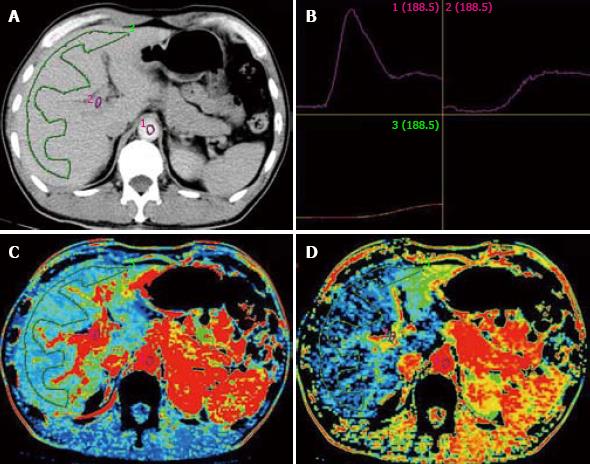
Figure 1 Normal liver perfusion image.
A: Selection of ROI at aorta, portal vein and liver; B: Time-density curve (TDC) for ROI (up left: aorta; up right: portal vein; down left: liver); C: Pseudo-color image of HBF; D: Pseudo-color image of HPI.
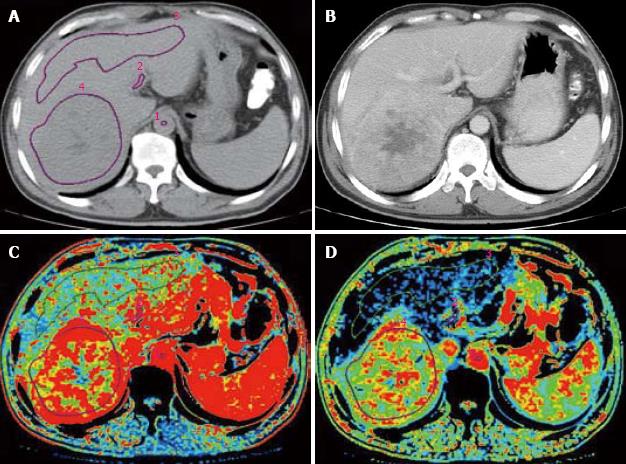
Figure 2 Liver perfusion image of primary hepatic carcinoma at right posterior lobe.
A: CT plain image with ROI; B: CT enhanced image of portal vein phase; C: Pseudo-color image of HBF; D: Pseudo-color image of HPI.
- Citation: Zhong L, Wang WJ, Xu JR. Clinical application of hepatic CT perfusion. World J Gastroenterol 2009; 15(8): 907-911
- URL: https://www.wjgnet.com/1007-9327/full/v15/i8/907.htm
- DOI: https://dx.doi.org/10.3748/wjg.15.907


