Copyright
©2009 The WJG Press and Baishideng.
World J Gastroenterol. Feb 28, 2009; 15(8): 1014-1017
Published online Feb 28, 2009. doi: 10.3748/wjg.15.1014
Published online Feb 28, 2009. doi: 10.3748/wjg.15.1014
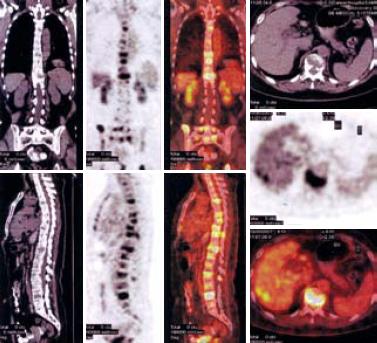
Figure 1 Multiple osteolytic bone lesions and nodular liver lesions (PET-CT).
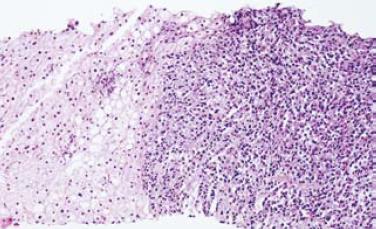
Figure 2 Nodular plasma cell infiltration in liver: myeloma on the right, liver tissue on the left and steatosis in the middle (HE-20 ×).
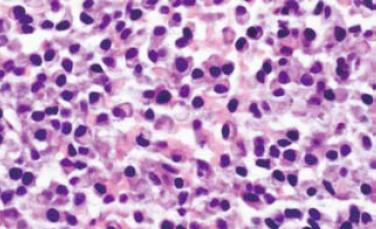
Figure 3 Plasma cell infiltration in liver (HE-60 ×).
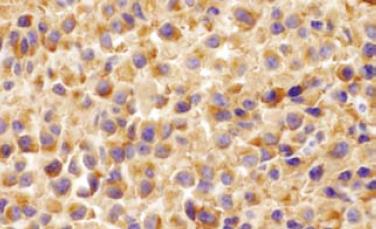
Figure 4 Positive staining of kappa light chain by immunohistochemistry in liver (60 ×).
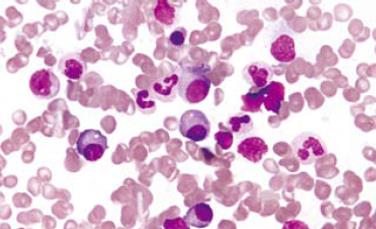
Figure 5 Plasmacytosis in bone marrow (HE-60 ×).
- Citation: Wu XN, Zhao XY, Jia JD. Nodular liver lesions involving multiple myeloma: A case report and literature review. World J Gastroenterol 2009; 15(8): 1014-1017
- URL: https://www.wjgnet.com/1007-9327/full/v15/i8/1014.htm
- DOI: https://dx.doi.org/10.3748/wjg.15.1014


