Copyright
©2009 The WJG Press and Baishideng.
World J Gastroenterol. Dec 14, 2009; 15(46): 5843-5850
Published online Dec 14, 2009. doi: 10.3748/wjg.15.5843
Published online Dec 14, 2009. doi: 10.3748/wjg.15.5843
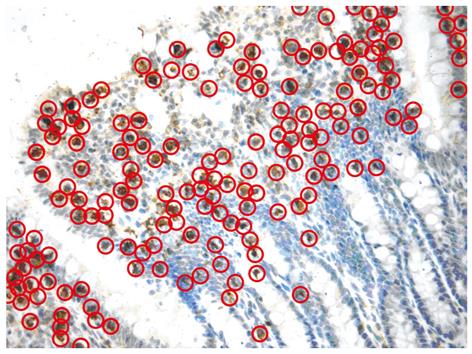
Figure 1 A sample image of immunohistochemical staining and TUNEL staining.
Some sample cells are circled to illustrate the positive cells that were counted (400 ×).
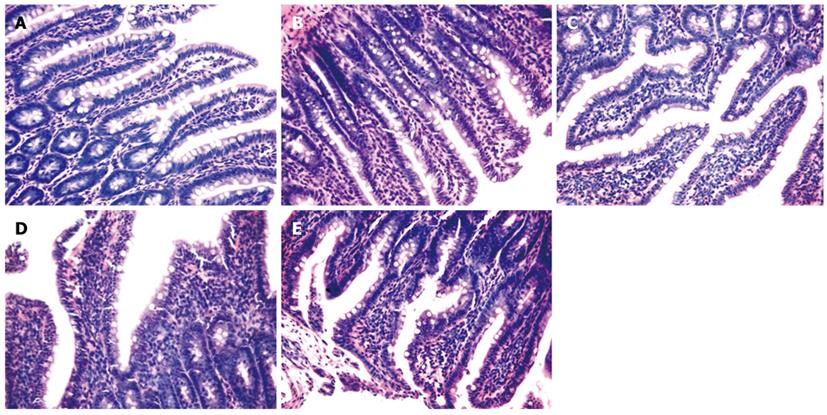
Figure 2 Representative images of the histological changes in the small intestinal mucosa of rats after LPS injection.
A: The intestinal mucosa of normal rats was complete and the villi were in an orderly fashion with no abnormal morphology present in the epithelial cells, as well as no manifestation of congestion, edema or infiltration of inflammatory cells; B-E: Representative of the changes 2, 6, 12 and 24 h after LPS treatment. The intestinal mucosal villi of rats with endotoxemia were loosened and atrophic while the epithelial cells were necrotic and the mucosa was edematous and infiltrated with inflammatory cells. The LPS-induced changes to the intestinal mucosa were most obvious in the rats after 12 h.
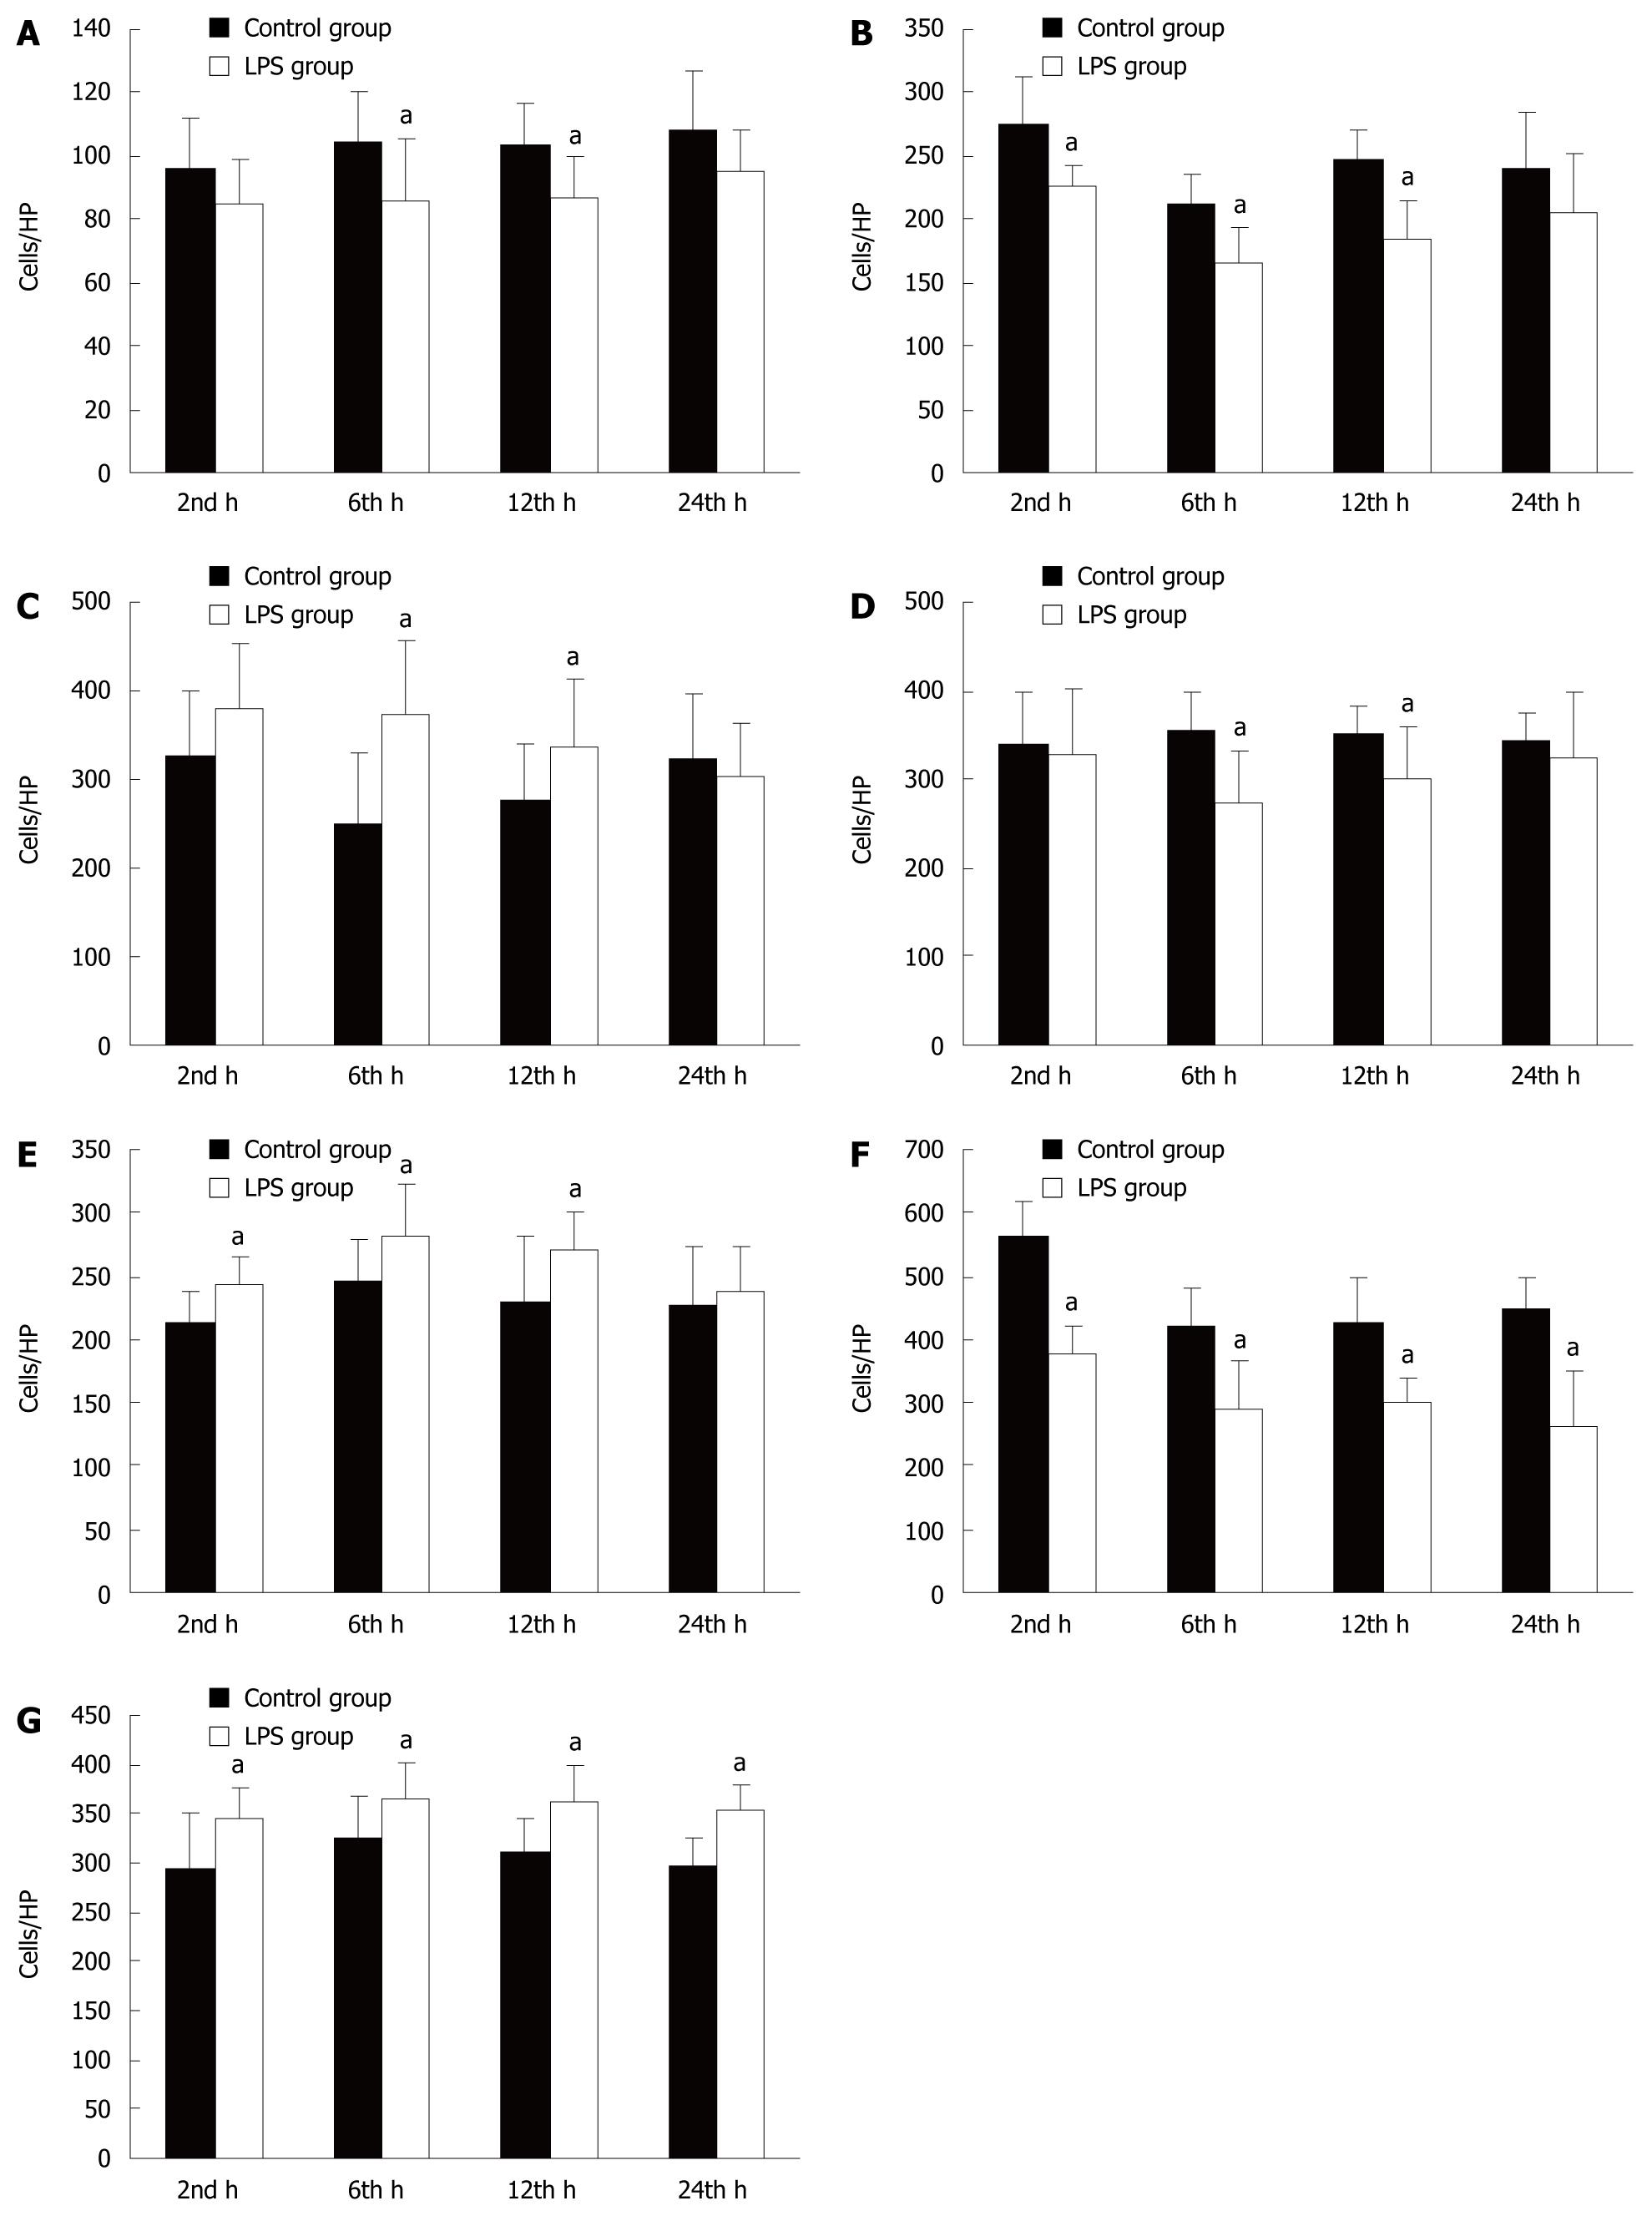
Figure 3 The number of immune cells and apoptotic lymphocytes in the intestinal mucosa.
A: The number of M-cells was significantly decreased after 6 and 12 h in the LPS group; B: The number of DCs was significantly decreased after 2, 6 and 12 h in the LPS group; C: The number of CD4+ T cells was significantly increased after 6 and 12 h before slightly decreasing by 24 h in the LPS group; D: The number of CD8+ T cells was significantly decreased after 6 and 12 h in the LPS group; E: The number of Tr cells was significantly increased after 2, 6 and 12 h in the LPS group; F: The number of IgA+ B cells was significantly increased at all time points in the LPS group; G: The number of apoptotic lymphocytes was significantly increased at all time points in the LPS group. aP < 0.05.
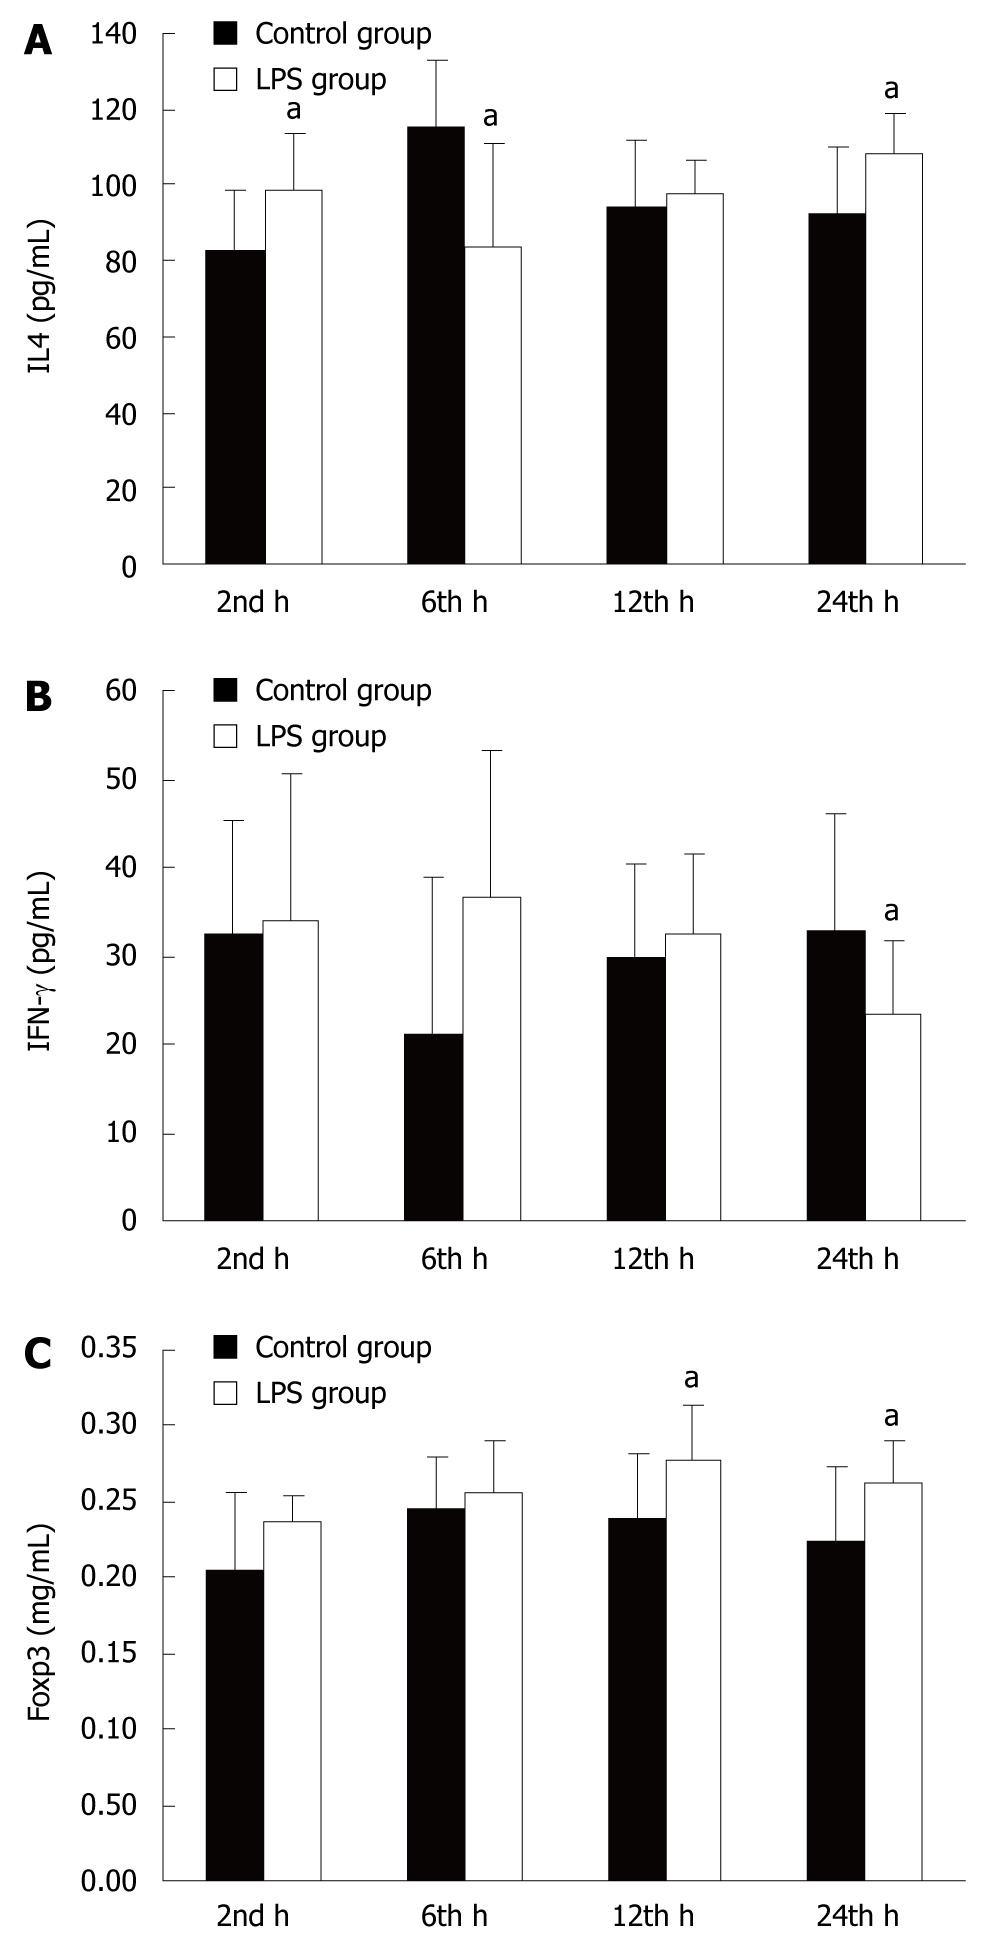
Figure 4 Levels of IL-4, IFN-γ and Foxp3 in small intestinal mucosa.
A: The level of IL-4 was significantly increased after 2 h and significantly decreased by 6 and 12 h in the LPS group; B: The level of IFN-γ was increased slightly after 2, 6 and 12 h and decreased markedly by 24 h in the LPS group; C: The level of Foxp3 was significantly increased after 12 and 24 h in the LPS group. aP < 0.05.
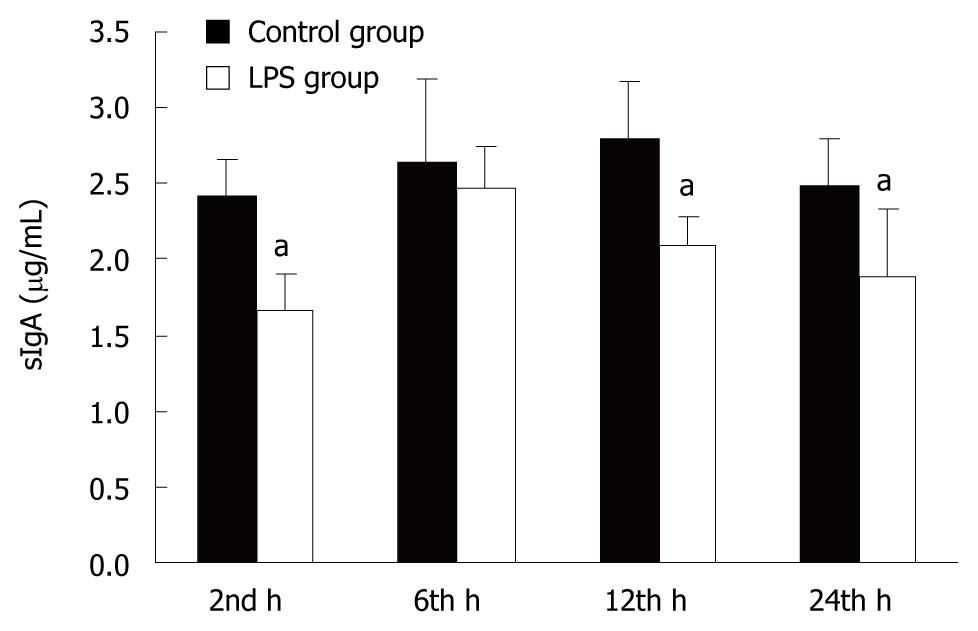
Figure 5 Small intestinal mucosa sIgA levels.
The level of intestinal mucus sIgA was significantly decreased after 2, 12 and 24 h in the LPS group. aP < 0.05.
- Citation: Liu C, Li A, Weng YB, Duan ML, Wang BE, Zhang SW. Changes in intestinal mucosal immune barrier in rats with endotoxemia. World J Gastroenterol 2009; 15(46): 5843-5850
- URL: https://www.wjgnet.com/1007-9327/full/v15/i46/5843.htm
- DOI: https://dx.doi.org/10.3748/wjg.15.5843


