Copyright
©2009 The WJG Press and Baishideng.
World J Gastroenterol. Dec 14, 2009; 15(46): 5789-5798
Published online Dec 14, 2009. doi: 10.3748/wjg.15.5789
Published online Dec 14, 2009. doi: 10.3748/wjg.15.5789
Figure 1 RAGE expression in hepatic stellate cells (A, B) and upregulation of RAGE expression during activation of HSC (C).
A: Bars represent RAGE mRNA expression, as determined by real time quantitative PCR relative to GAPDH mRNA, by freshly isolated rat hepatocytes (Hep), 10 d culture-activated primary rat HSC, CFSC-2G and HSC-T6 HSC lines, and human HSC; B: RAGE protein is detected as a 57 kDa band after SDS-PAGE of cell lysates and Western blotting with a monoclonal anti-RAGE IgG. Experiments were repeated at least three times with similar results; C: Freshly isolated rat HSC were culture-activated for 1, 5, and 10 d and RAGE mRNA expression was quantified by real-time PCR. Bars represent mean RAGE expression ± SD in arbitrary units relative to GAPDH from at least three individual experiments. Values were normalized to 50 ng of extracted RNA transcribed into cDNA. bP < 0.01 vs 1 d activation. RAGE: Receptor for advanced glycation end products; HSC: Hepatic stellate cells; GAPDH: Glyceraldehyde-3-phosphate dehydrogenase.
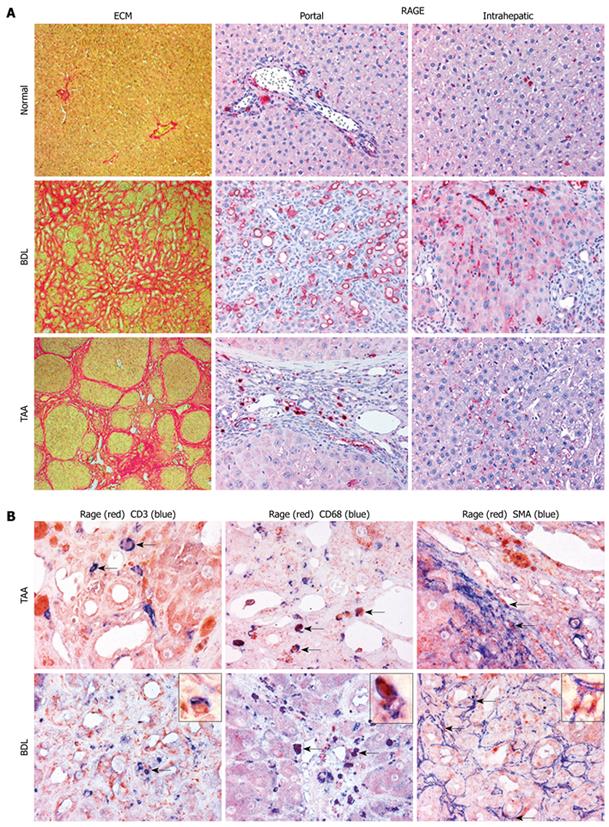
Figure 2 Cell-specific expression patterns of RAGE in normal and cirrhotic rat livers.
A: Portal and lobular expression patterns of RAGE in normal liver and in livers of rats with cirrhosis due to BDL or TAA treatment (magnification, × 200). Parallel sections were stained for collagen with picrosirius red. In normal liver, minor RAGE expression was found in endothelial cells of portal veins and arteries, in bile duct epithelia as well as in lymphocytes, macrophages and (myo-) fibroblasts in the hepatic lobular areas. No RAGE expression was found in hepatocytes. RAGE was clearly upregulated in cirrhosis induced by BDL and TAA, with higher numbers of RAGE-expressing cells in BDL, mainly attributable to a prominent contribution by proliferating bile duct epithelial cells. In areas of lobular fibrosis, perisinusoidal endothelia started to express RAGE, apparently in parallel with sinusoidal capillarization; B: Double labeling immunohistochemistry for RAGE (in red) in combination with CD3 (T-lymphocytes), CD68 (macrophages), and α-SMA (myofibroblasts) (in blue), magnification × 400 being exemplarily highlighted with insets (magnification, × 1000). In both cirrhosis models, mainly CD3-positive T-lymphocytes and CD68-positive macrophages expressed RAGE, independently of their microanatomic locations (portal, interface, septal or intrahepatic). Additionally, RAGE was more colocalized with macrophages than with T-lymphocytes independent of the cirrhosis model. RAGE expression was also found on α-SMA-positive myofibroblasts, either localized around periportal bile duct proliferations in BDL or in the interface and septal area in TAA-induced cirrhosis (co-localization indicated by arrows). BDL: Bile duct ligation; TAA: Thioacetamide; SMA: Smooth muscle actin; ECM: Extracellular matrix.
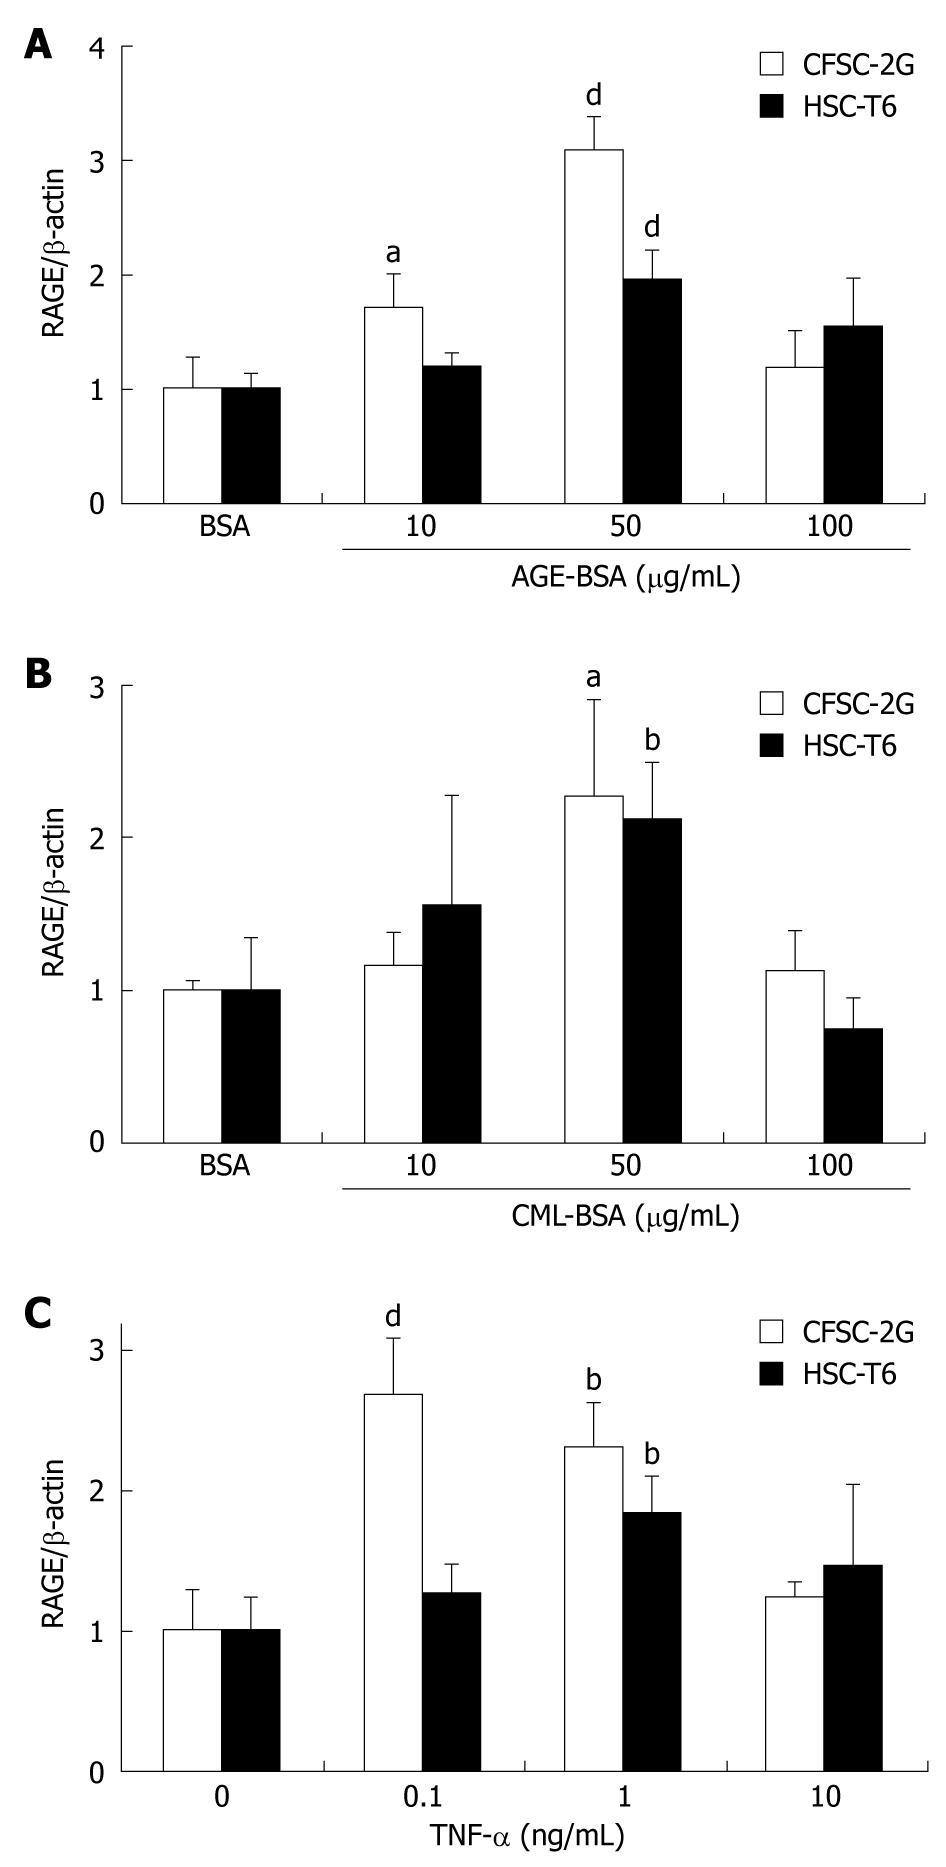
Figure 3 Advanced glycation end product-bovine serum albumin (AGE-BSA) (A), Nε-(carboxymethyl) lysine (CML)-BSA (B) and tumor necrosis factor (TNF)-α (C) upregulate RAGE protein expression in hepatic stellate cells.
Mean RAGE protein expression as determined by quantitative Western blotting from extracts of rat HSC lines relative to β-actin. Cells were incubated for 24 h and results are derived from at least three independent experiments and expressed as mean ± SD. Data are shown as x-fold increase compared to cells incubated with BSA alone. aP < 0.05, bP < 0.01, dP < 0.001 vs BSA.
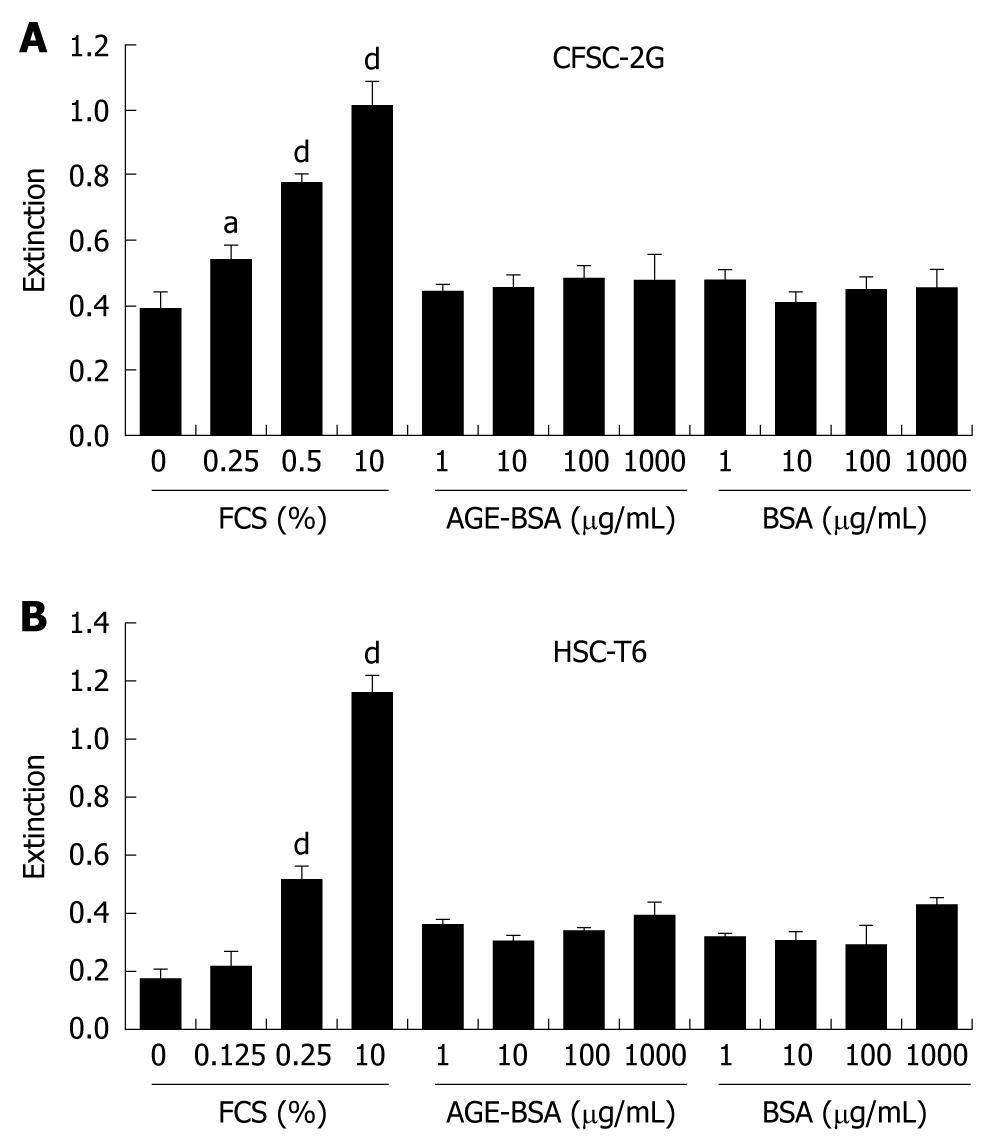
Figure 4 AGE do not stimulate DNA synthesis in hepatic stellate cells.
DNA synthesis as a surrogate of proliferation was determined in CFSC-2G (A) and HSC-T6 (B) HSC after a 24 h incubation with increasing concentrations of FCS, AGE-BSA or CML-BSA in 0% FCS. Data are results of six independent experiments and expressed as mean ± SD. aP < 0.05, dP < 0.001 vs 0% FCS.
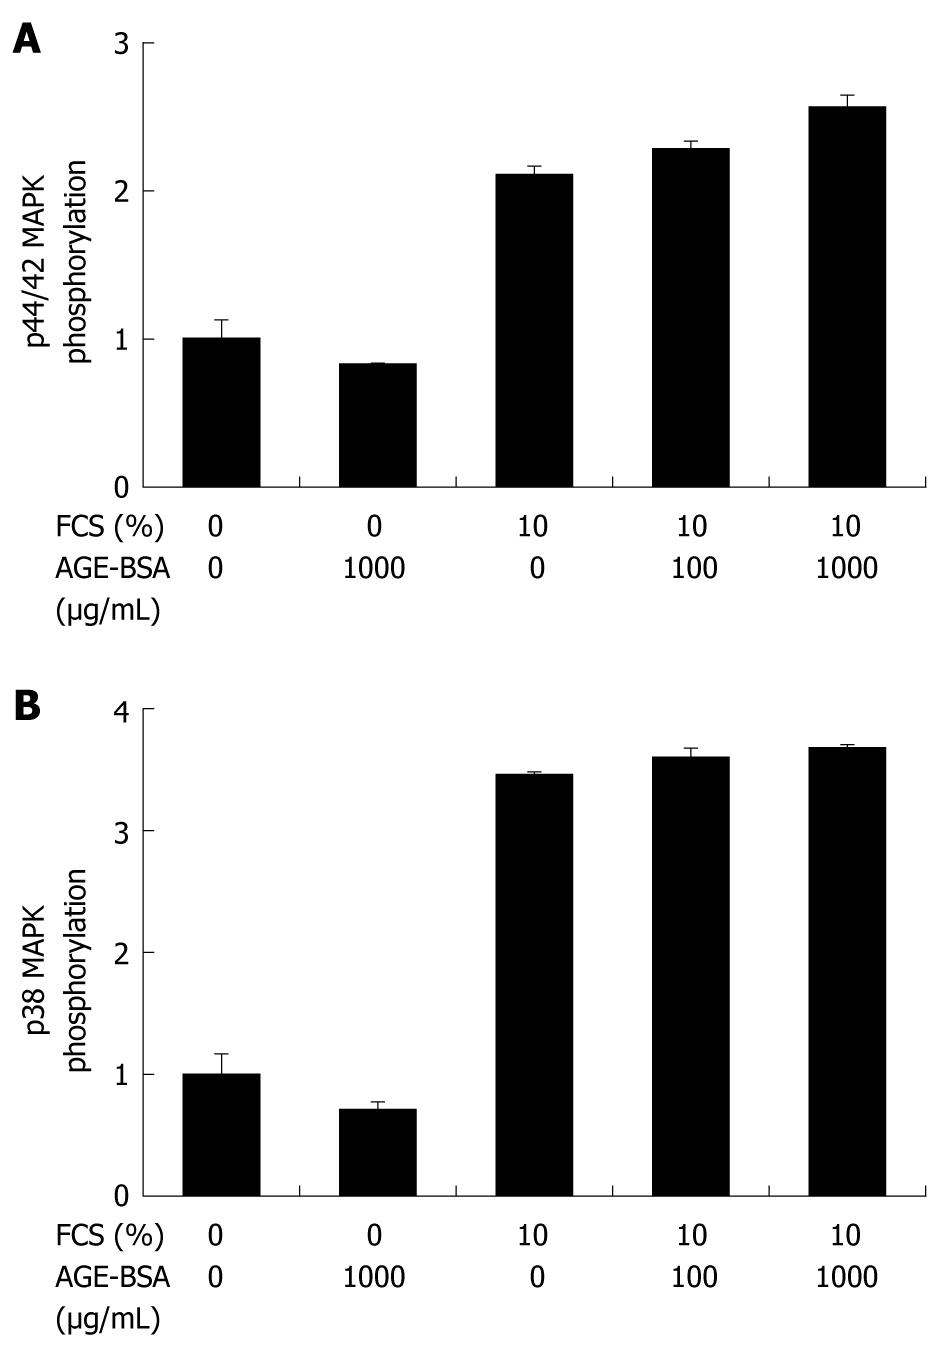
Figure 5 AGE-BSA does not activate p44/42 (A) and p38 (B) MAPK signaling in hepatic stellate cells.
Kinase phosphorylation was determined in CFSC-2G and HSC-T6 HSC using quantitative western blotting with phosphospecific antibodies relative to total kinase antibodies after a 10 min incubation with increasing concentrations of AGE-BSA or CML-BSA in 0% to 10% FCS. Bars represent n-fold phosphorylation compared to controls with 0% FCS and results are derived from at least three individual experiments.
- Citation: Lohwasser C, Neureiter D, Popov Y, Bauer M, Schuppan D. Role of the receptor for advanced glycation end products in hepatic fibrosis. World J Gastroenterol 2009; 15(46): 5789-5798
- URL: https://www.wjgnet.com/1007-9327/full/v15/i46/5789.htm
- DOI: https://dx.doi.org/10.3748/wjg.15.5789


