Copyright
©2009 The WJG Press and Baishideng.
World J Gastroenterol. Nov 7, 2009; 15(41): 5165-5175
Published online Nov 7, 2009. doi: 10.3748/wjg.15.5165
Published online Nov 7, 2009. doi: 10.3748/wjg.15.5165
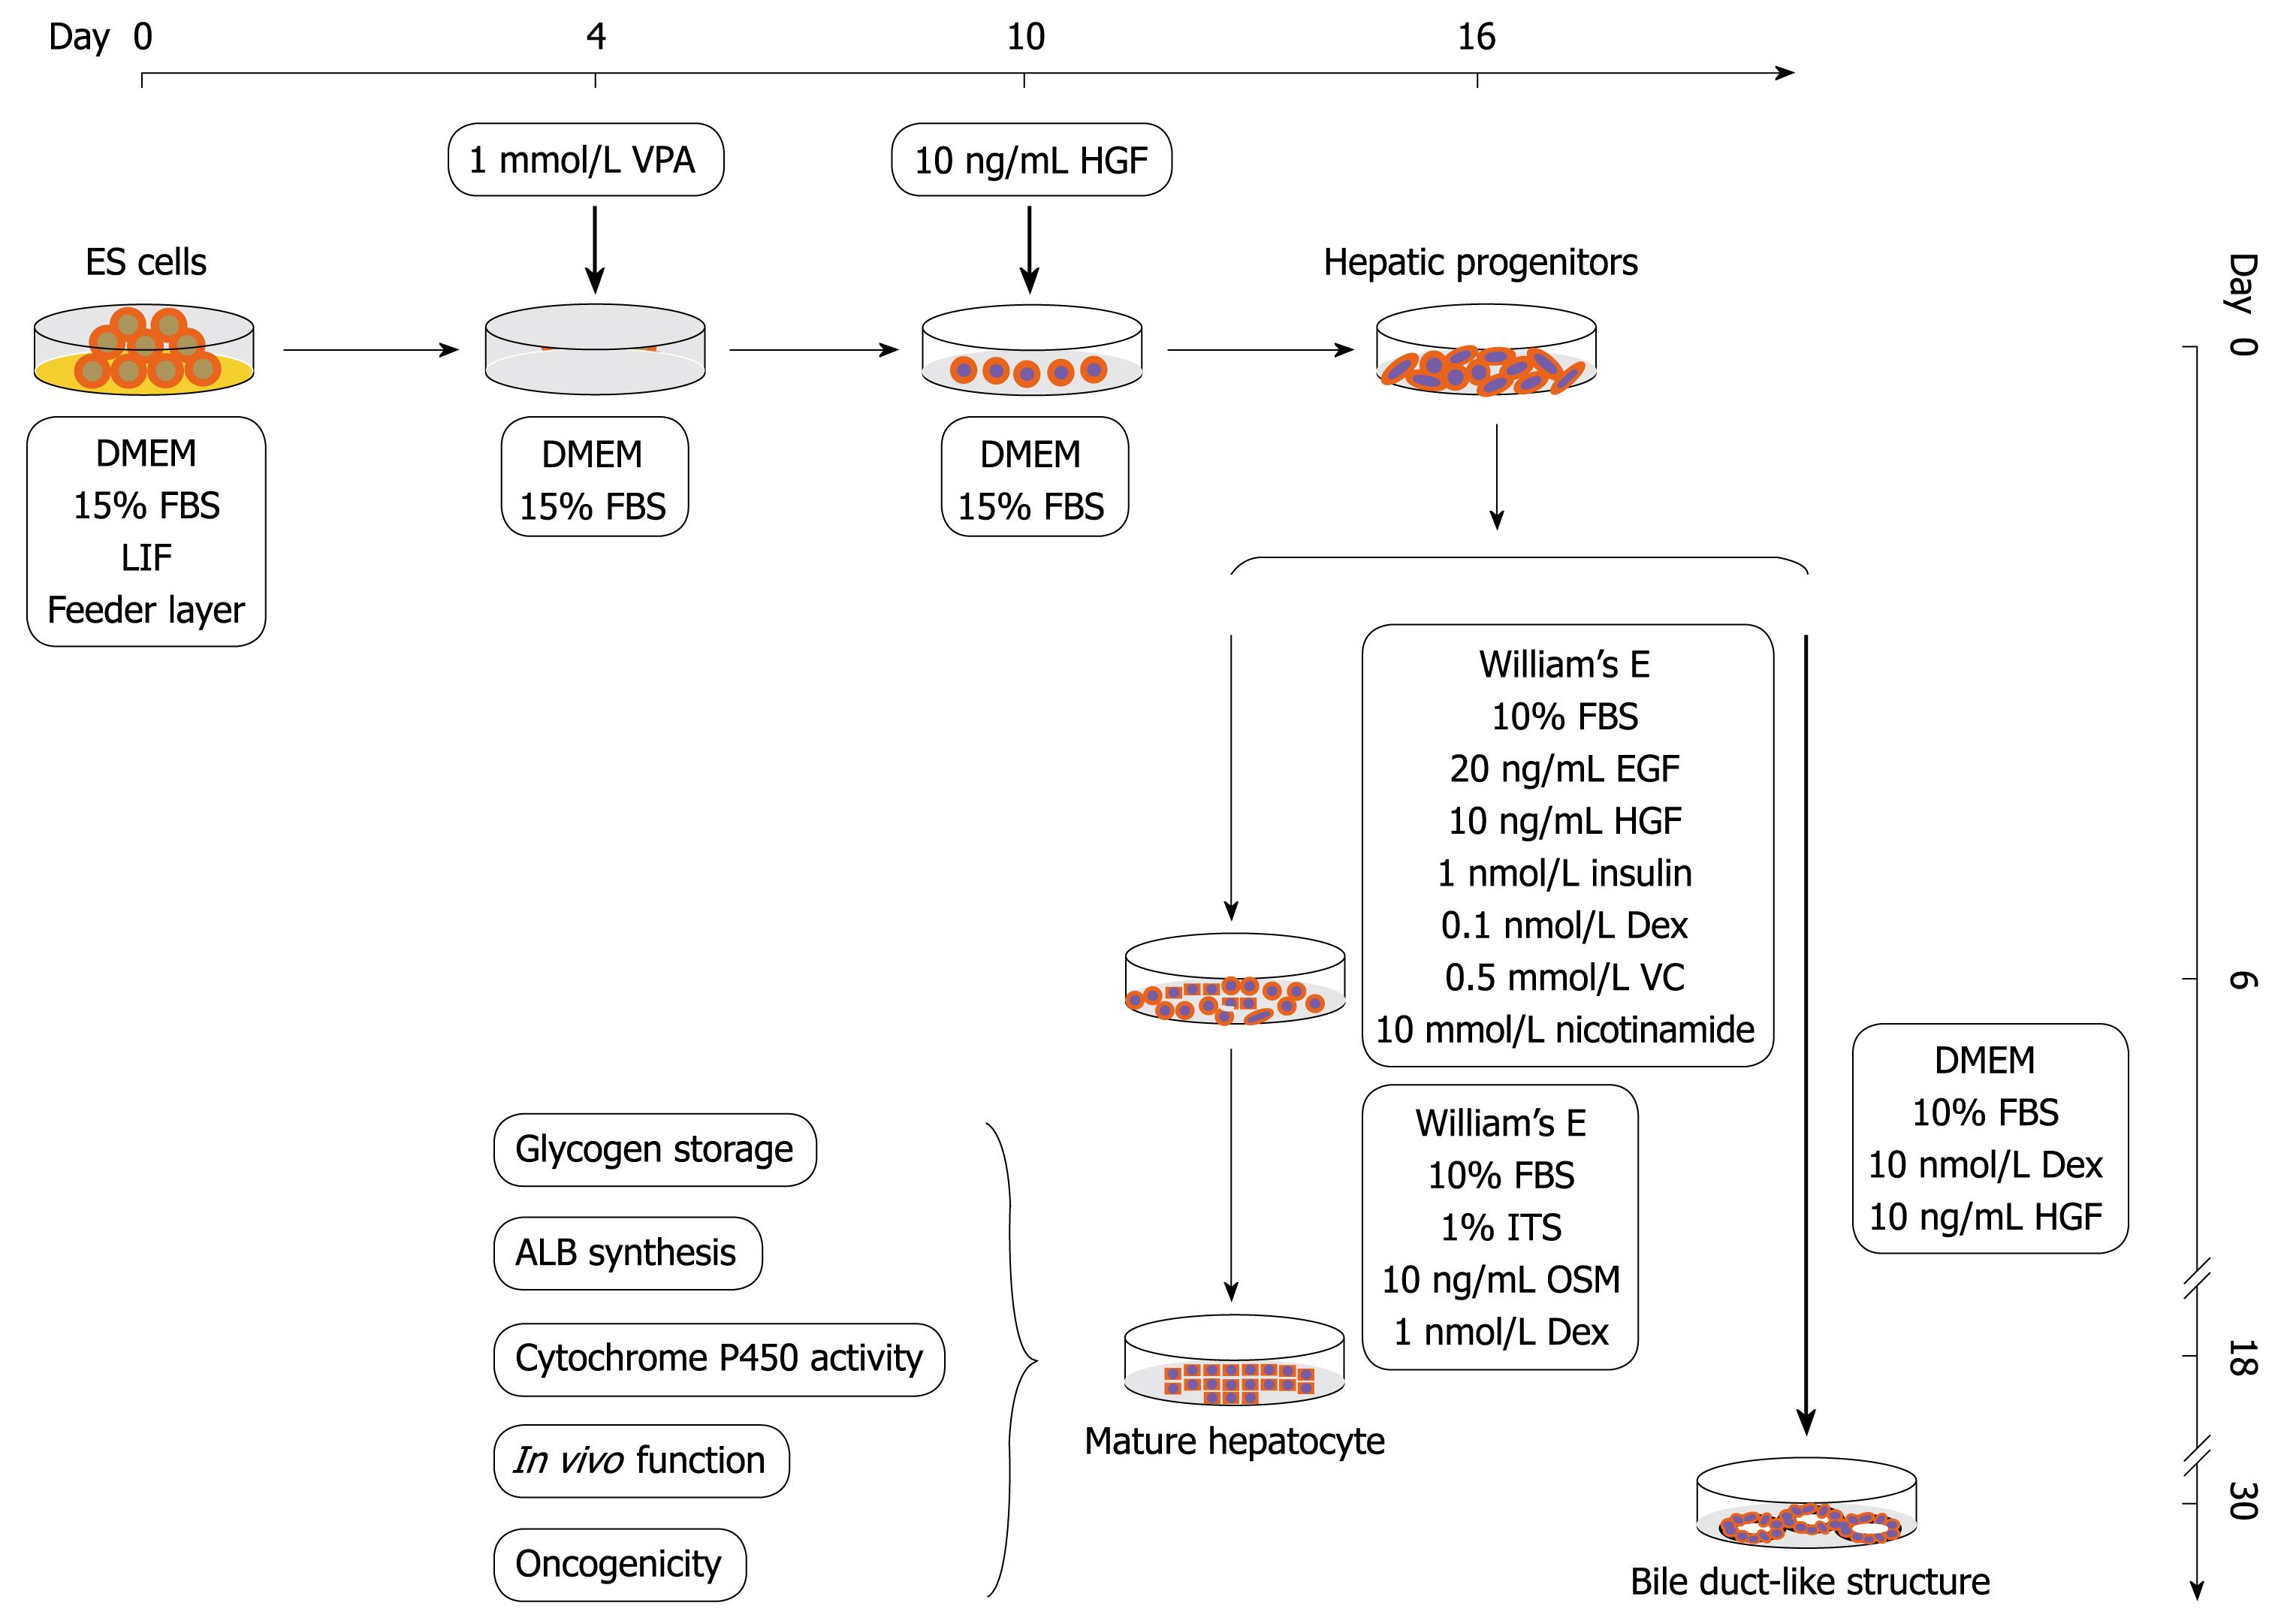
Figure 1 Schematic presentation of the protocol.
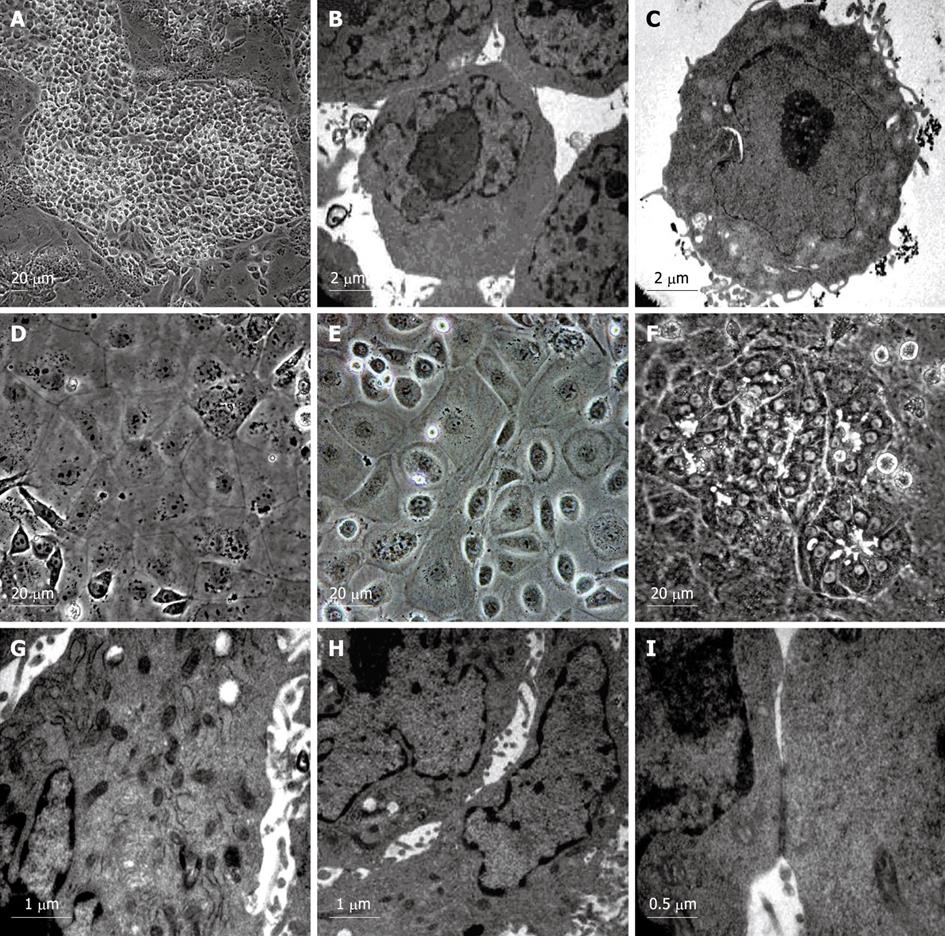
Figure 2 Morphological observation of the differentiated cells.
A: Morphology of hepatic progenitor cells induced by VPA; B: Electron microscopic observation of the undifferentiated ES cells (control); C: Electron microscopic observation of the hepatic progenitor cells differentiated from ES cells; D, E: Morphological observation of typical hepatocytes differentiated from hepatic progenitor cells with flattened and cuboidal morphology, and acquired abundant granules in the cytoplasm; F: Morphological observation of another kind of hepatocyte-like cells differentiated from hepatic progenitor cells with rising and piled morphology, dark cytoplasm and light nuclei, and bile canaliculi-like structures found between these cells; G: Electron microscopic observation of the differentiated hepatocytes with abundant mitochondria in their cytoplasm; H: Electron microscopic observation of the bile canaliculi between adjacent cells as mentioned above (Figure 1F); I: The bile canaliculi between adjacent cells sealed with tight junctions.
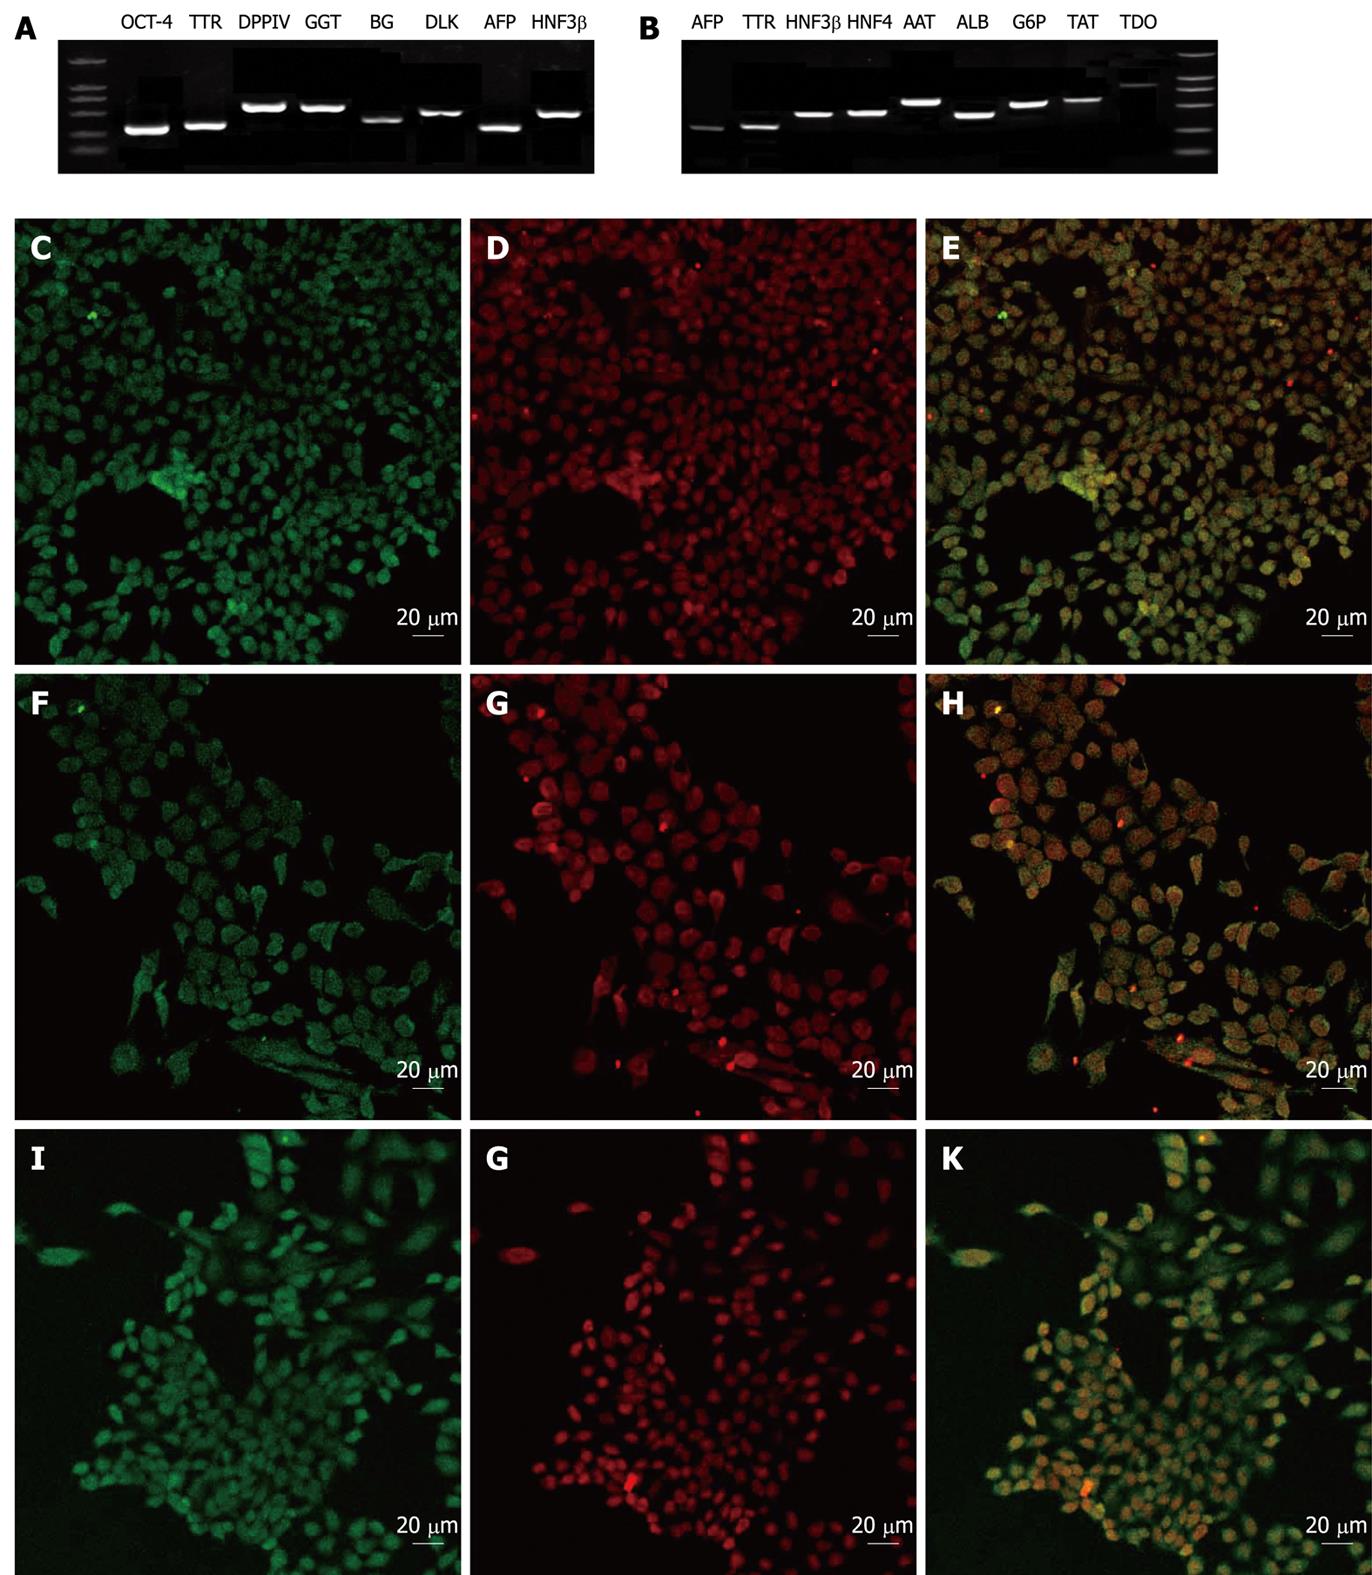
Figure 3 Gene expression analysis of VPA-induced hepatic lineage cells by RT-PCR and immunofluorescence staining.
A: RT-PCR showed hepatic progenitor cells after the treatment with valproic acid expressing most typical markers of hepatic/hepatic stem cells; B: The hepatic progenitor-derived hepatocytes expressing typical markers of mature liver cells; C-E: Immunofluorescent images of AFP (C) and OCT-4 (D) staining in VPA-induced hepatic progenitor cells (E is the merged image of C and D); F-H: Immunofluorescent images of AFP (F) and CK19 (G) staining in VPA-induced hepatic progenitor cells (H is the merged image of F and G); I-K: Immunofluorescent images of AFP (I) and DLK (J) staining in VPA-induced hepatic progenitor cells (K is the merged image of I and J).
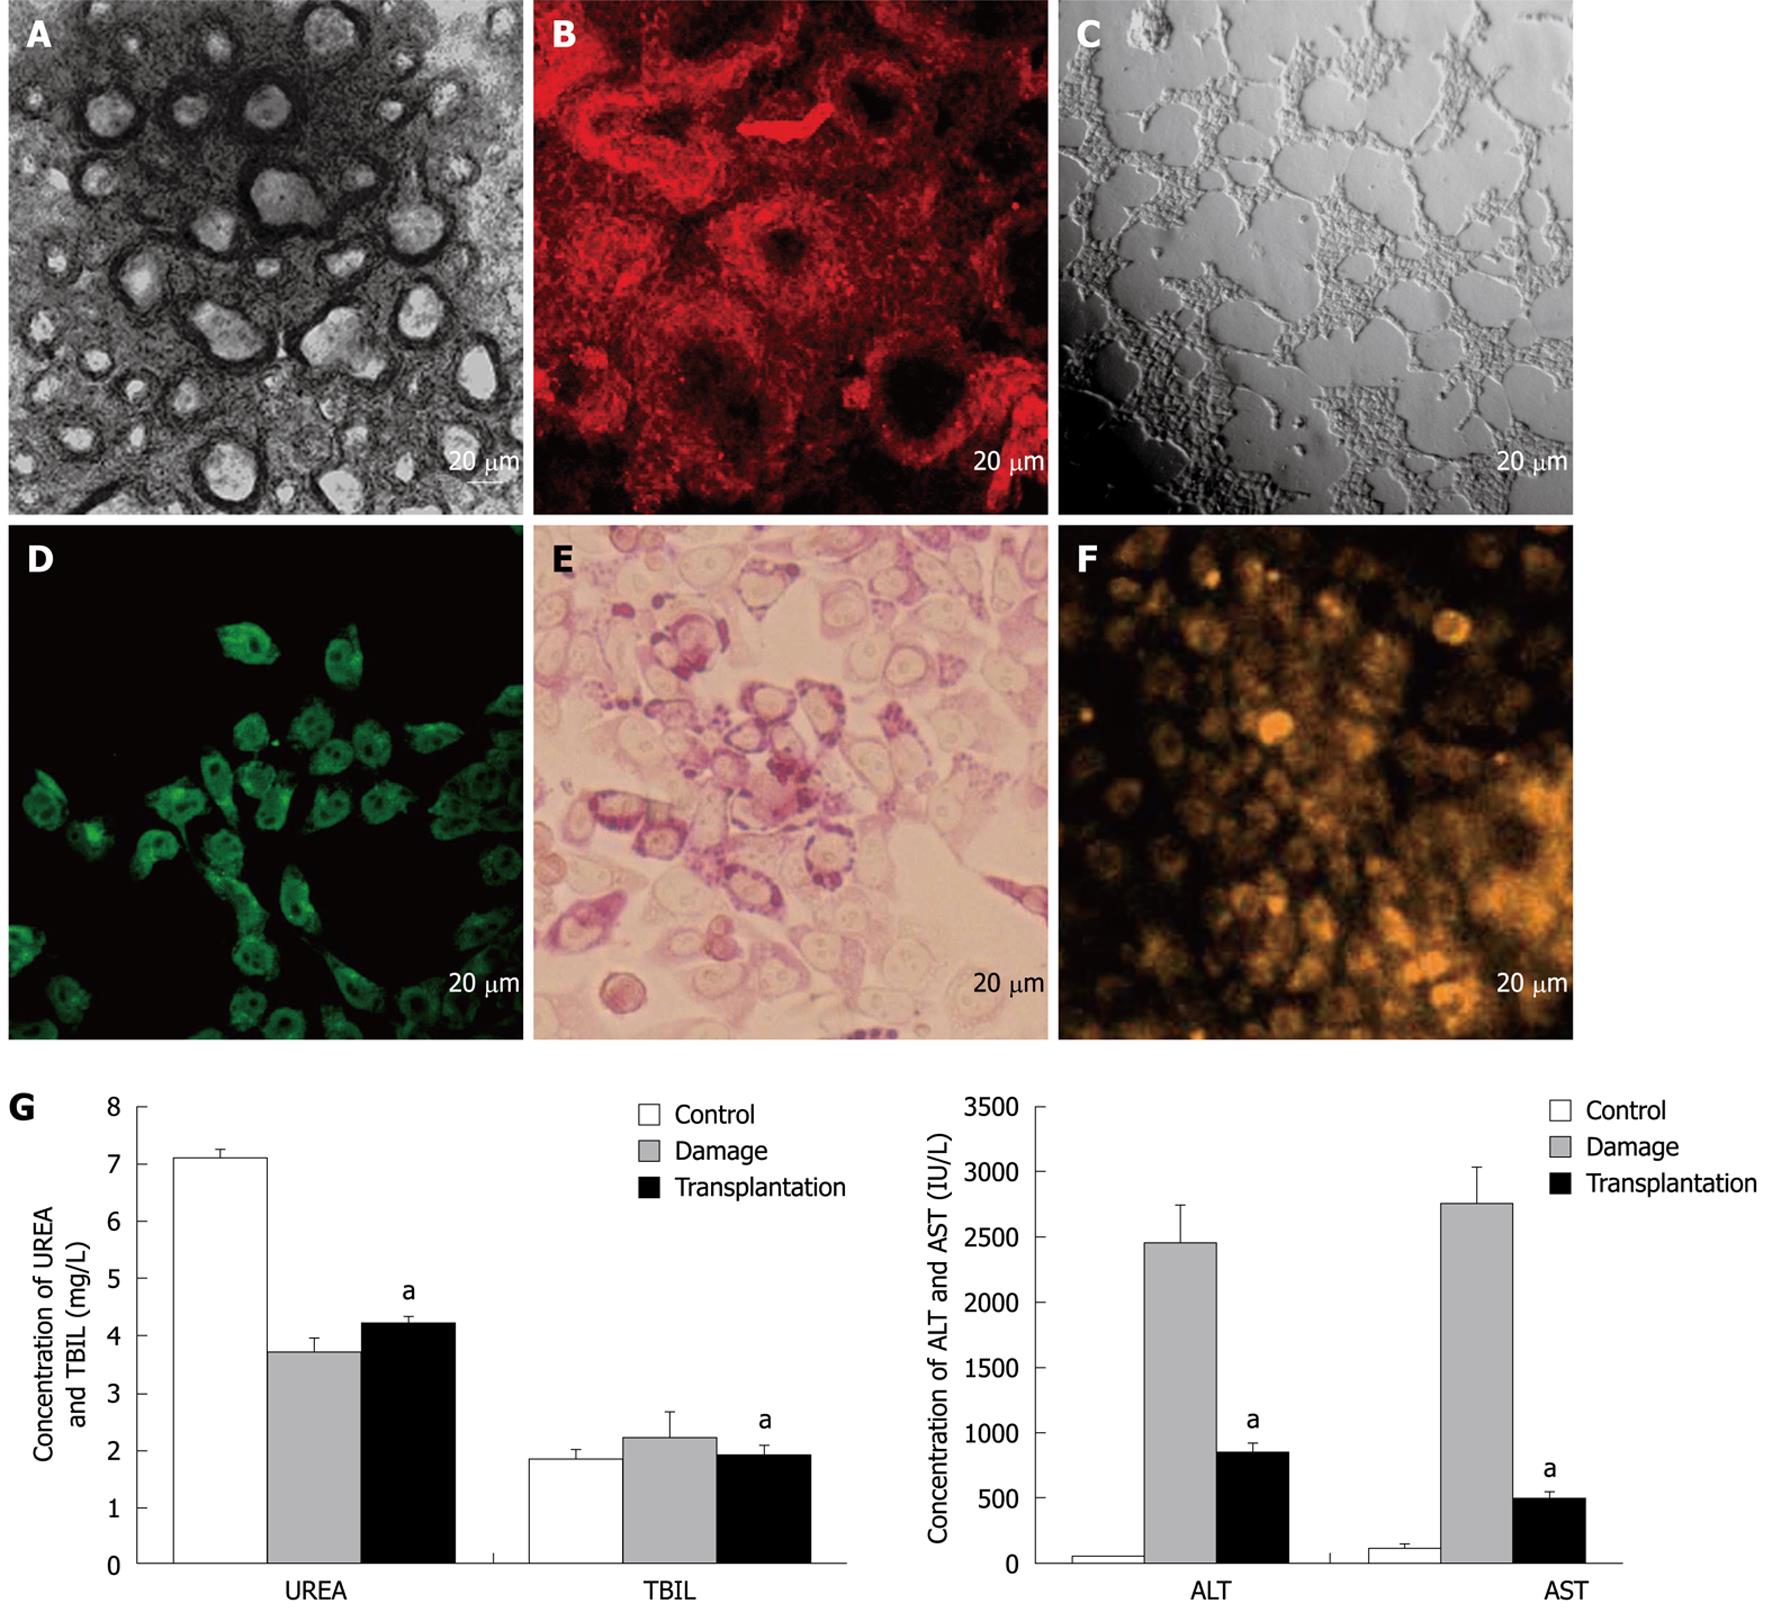
Figure 4 Functional characterization of the hepatic lineage cells.
A: Bile duct-like structures formed from the VPA-induced hepatic progenitor cells cultured on collagen I coated dishes; B: Bile duct-like structures were stained CK19 positive; C: Bile duct-like structures formed from the VPA-induced hepatic progenitor cells cultured on Matrigel basement membrane matrix; D-F: Differentiated hepatocytes from hepatic progenitor cells could synthesize albumin (D), store glycogen (E) and possessed cytochrome P450 activity (F) after induction for 2-3 wk; G: When ES-HPCs derived hepatocytes were transplanted 6 h after liver intoxication, serum total bilirubin (TBIL), serum ammonia (UREA), AST and ALT levels were significantly improved towards normal at 1 d after the transplantation. aP < 0.05.
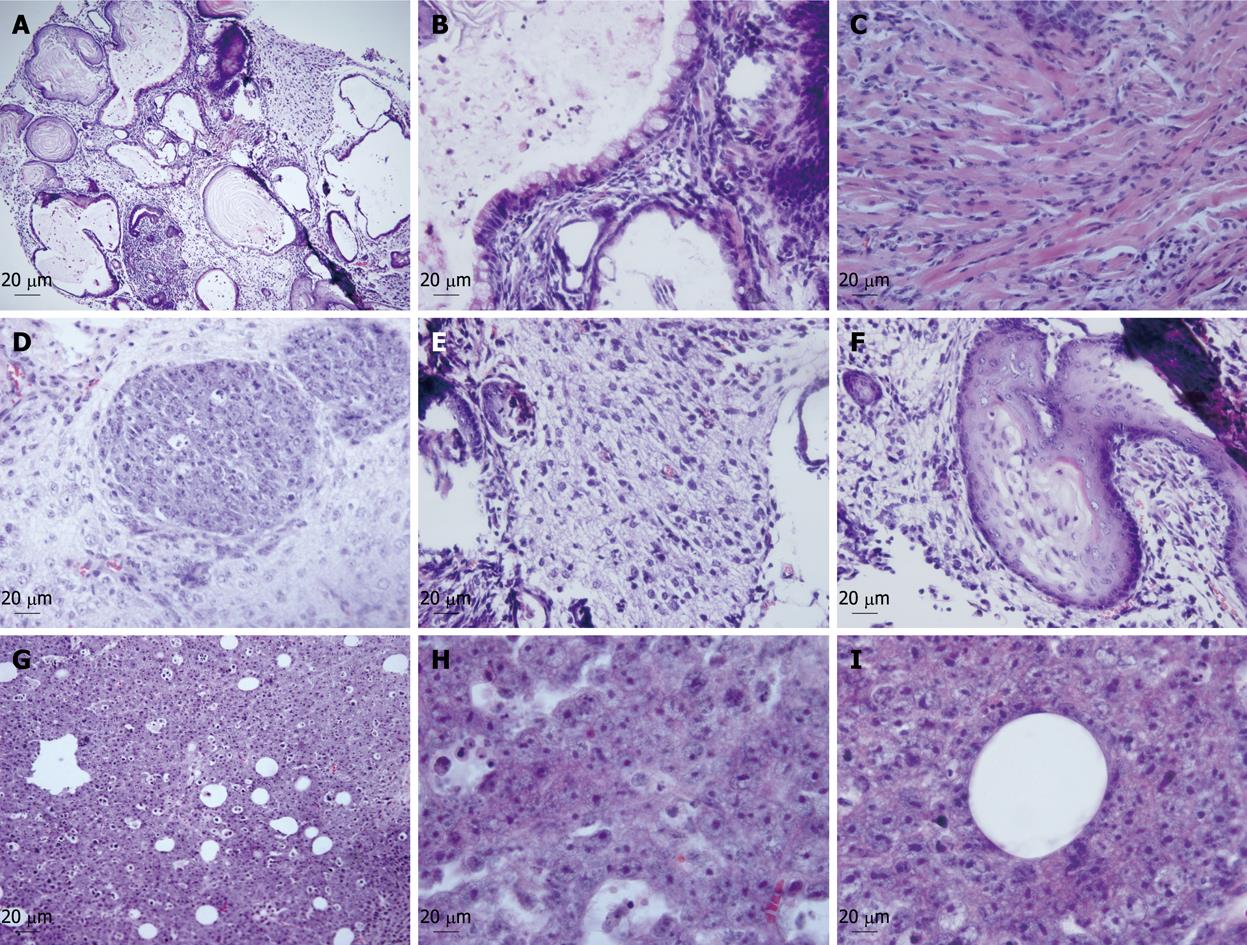
Figure 5 In vivo multi-differentiation potential and tumorigenic analyses.
A-F: The teratomas derived from ES cells were composed of a variety of types of differentiated cells from all three primary germ layers including secretory glands (B), muscle (C), epithelium (D), neuroectodermal cells (E) and cartilage (F); G-I: The tumor-like bumps derived from ES-HPCs contained only epithelial (H) and mesenchymal-like cells, and duct-like structures (I) surrounded by several epithelial cells were also observed.
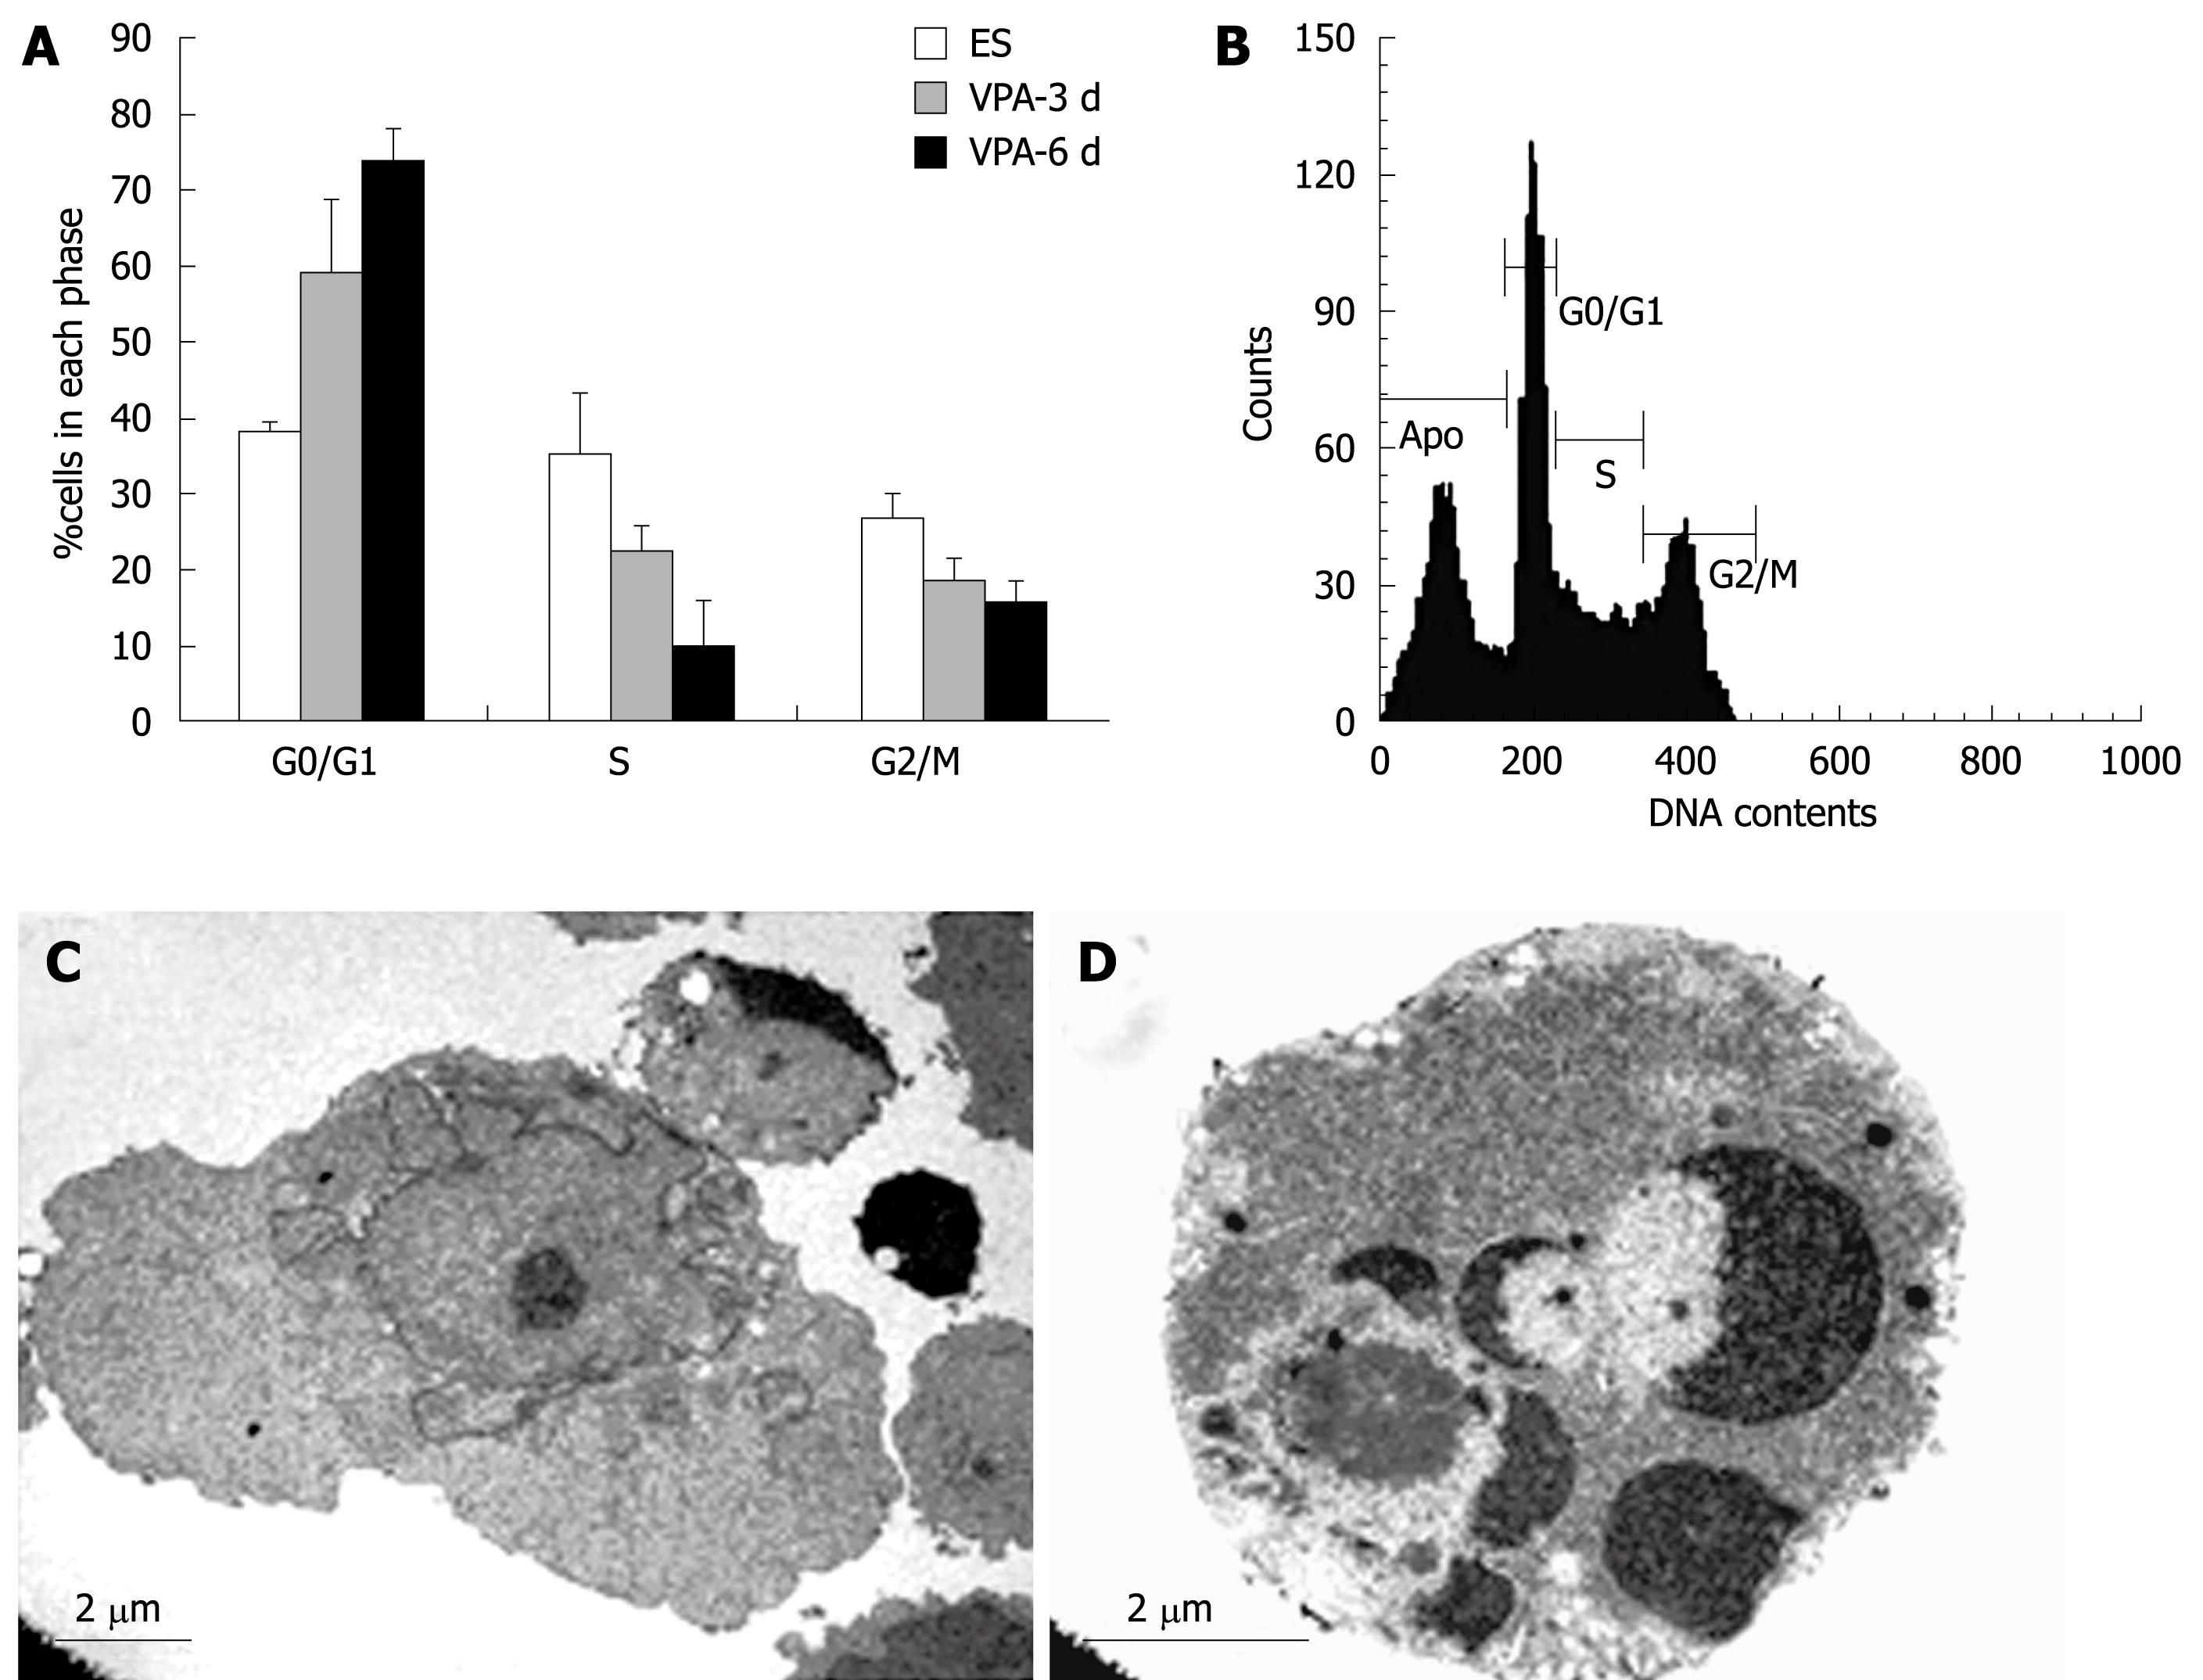
Figure 6 VPA-induced cell cycle arrest and apoptosis during hepatic differentiation.
A: Cell cycle analysis revealed that exposure to VPA decreased the proportion of cells in S phase and increased the proportion of cells in the G0/G1 phase. Approximately 75% of the cells were arrested in the G0/G1 phase and only 10% of the cells in the S phase after 6 d of treatment with 1 mmol/L VPA, whereas greater than 37% of control ES cells were in the S phase; B: The analysis of apoptosis proportions during 3 d of treatment with VPA; C, D: Ultrastructural observations showed that some cells presented typical apoptotic morphology when treated with VPA for more than 5 d.
- Citation: Dong XJ, Zhang GR, Zhou QJ, Pan RL, Chen Y, Xiang LX, Shao JZ. Direct hepatic differentiation of mouse embryonic stem cells induced by valproic acid and cytokines. World J Gastroenterol 2009; 15(41): 5165-5175
- URL: https://www.wjgnet.com/1007-9327/full/v15/i41/5165.htm
- DOI: https://dx.doi.org/10.3748/wjg.15.5165


