Copyright
©2009 The WJG Press and Baishideng.
World J Gastroenterol. Oct 14, 2009; 15(38): 4763-4769
Published online Oct 14, 2009. doi: 10.3748/wjg.15.4763
Published online Oct 14, 2009. doi: 10.3748/wjg.15.4763
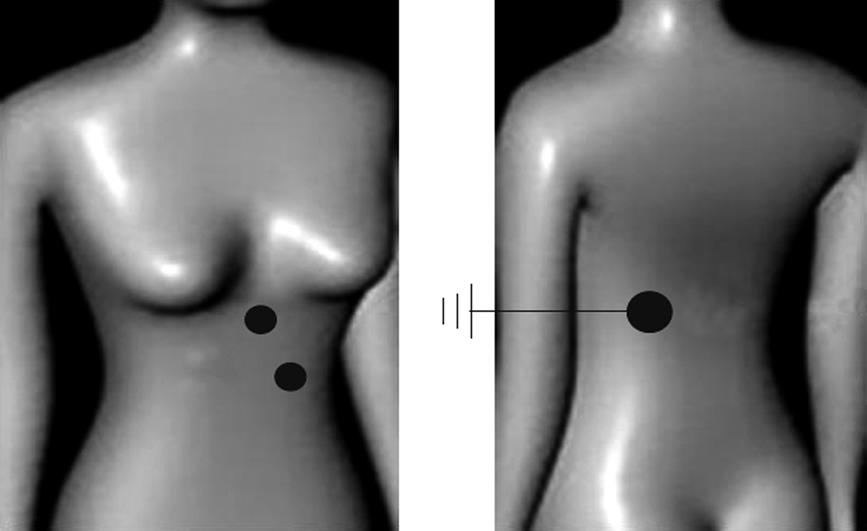
Figure 1 The figure shows the three electrode configuration, with the ground electrode placed on the back.
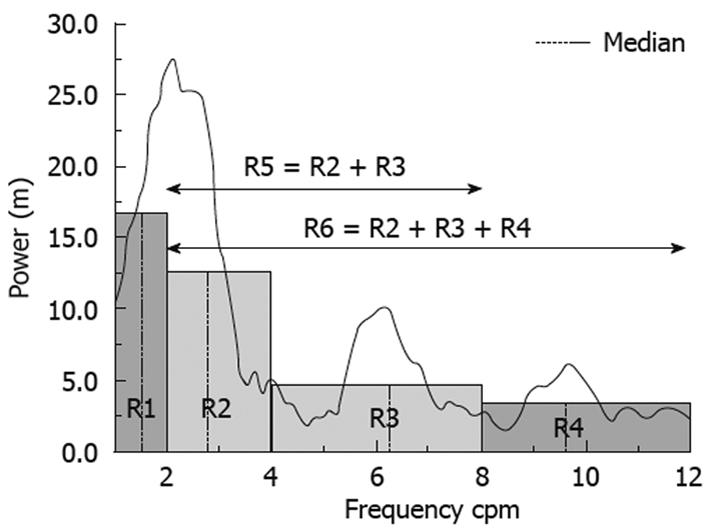
Figure 2 The figure demonstrates the definition of the regions (R1 to R6) considered in this study.
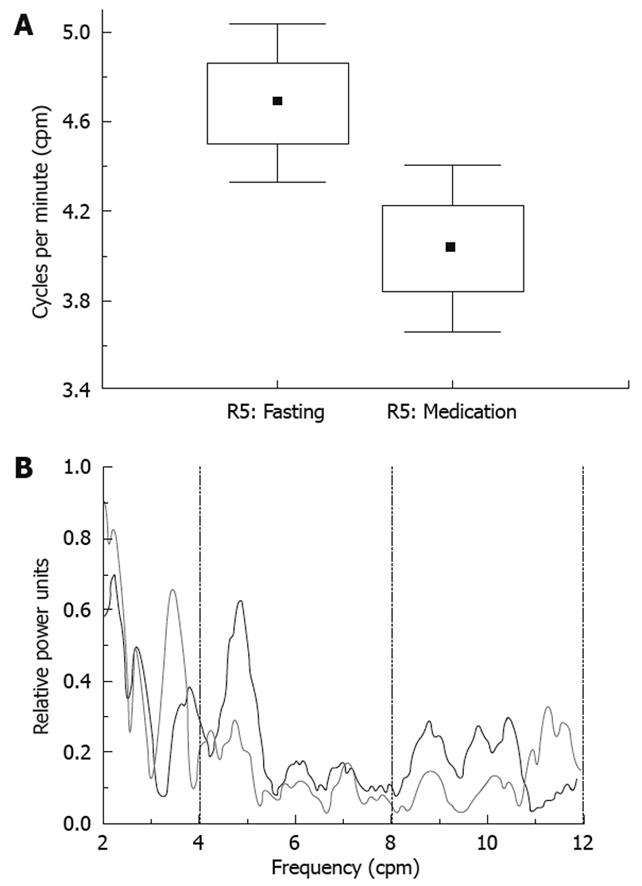
Figure 3 Changes in the median of the area under the region R5, from 2 to 8 cpm.
A: Median change for the average of all individuals between the fasting and medicated states for R5 (from 2 to 8 cpm) t = 3.32, P = 0.004; B: This graph is an example of the change of R5 in an individual recording: fasting in black and medication in grey.
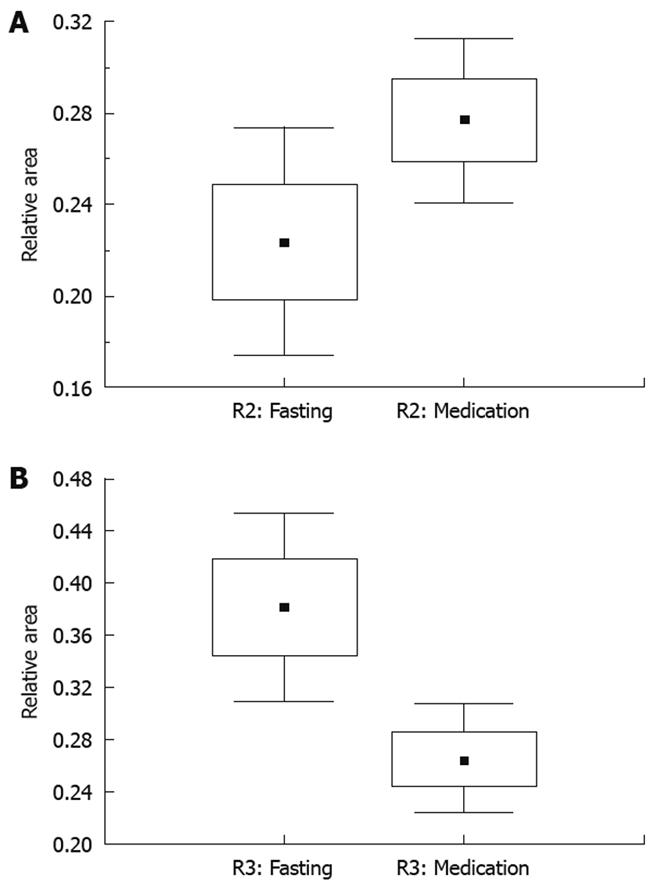
Figure 4 Average change in the median for R2 (A: t = -2.
5, P = 0.022) and R3 (B: t = 2.81, P = 0.012) between the fasting and medication conditions.
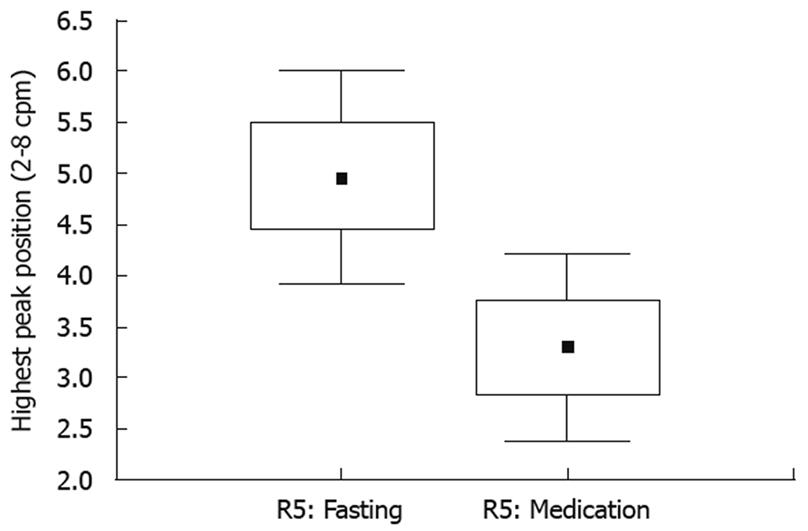
Figure 5 Change in average main peak position between the fasting and medicated state in R5.
T test for dependent samples, t = 2.47, P = 0.025.
- Citation: Huerta-Franco MR, Vargas-Luna M, Capaccione KM, Yañez-Roldán E, Hernández-Ledezma U, Morales-Mata I, Córdova-Fraga T. Effects of metoclopramide on gastric motility measured by short-term bio-impedance. World J Gastroenterol 2009; 15(38): 4763-4769
- URL: https://www.wjgnet.com/1007-9327/full/v15/i38/4763.htm
- DOI: https://dx.doi.org/10.3748/wjg.15.4763


