Copyright
©2009 The WJG Press and Baishideng.
World J Gastroenterol. Oct 7, 2009; 15(37): 4695-4708
Published online Oct 7, 2009. doi: 10.3748/wjg.15.4695
Published online Oct 7, 2009. doi: 10.3748/wjg.15.4695
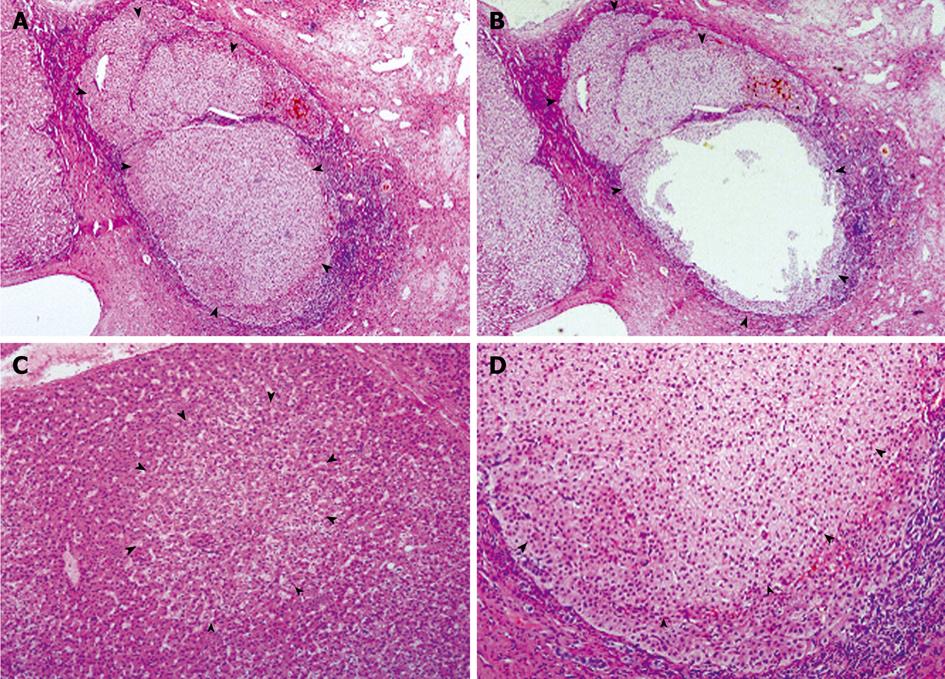
Figure 1 Preneoplastic lesions in classical FNH.
A and B: FNH04 from Case 03, showing a nodule largely occupied by an expanding NAH (arrowheads), before (A) and after microdissection (B); C: Portion of FNH06, showing an FAH (arrowheads), in which the altered hepatocytes integrate well with the surrounding hepatic plate; D: Portion of an NAH composed mainly of clear hepatocytes (arrowheads), showing compression to surrounding liver parenchyma. HE, A and B, × 40; C and D, × 100.
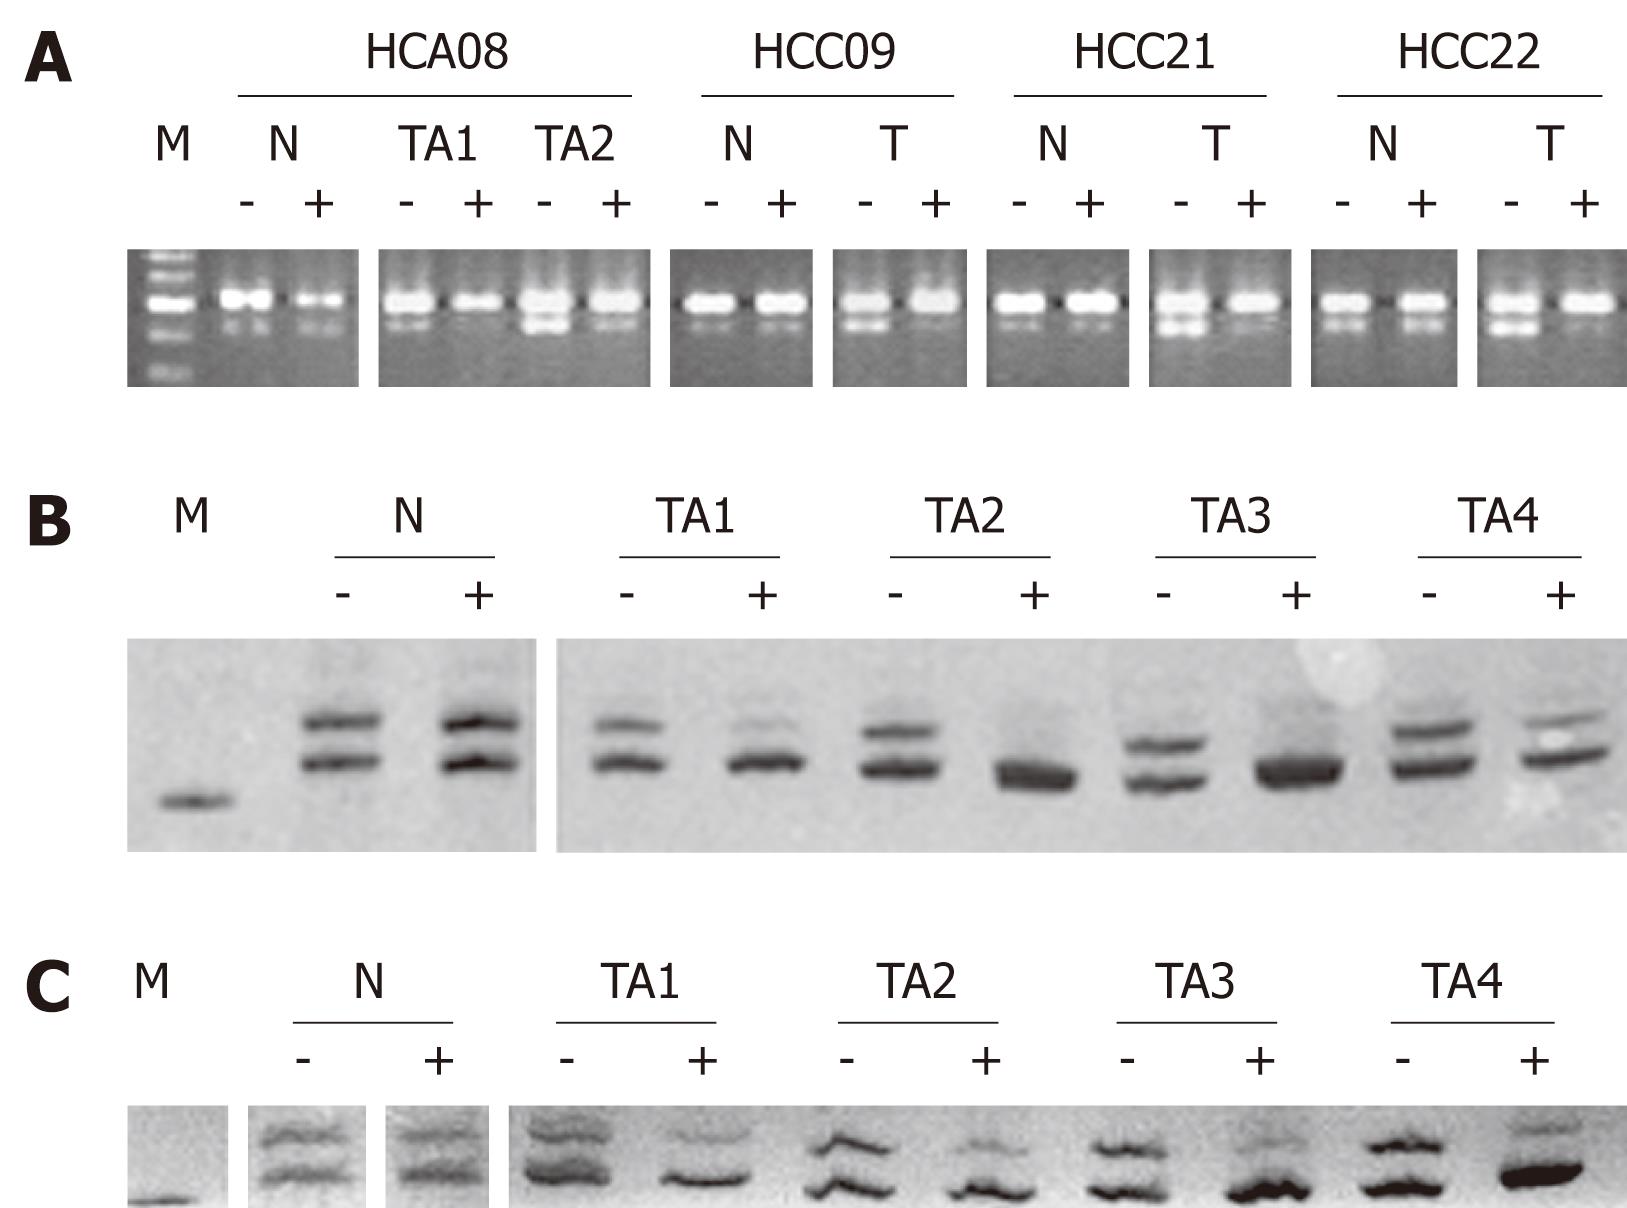
Figure 2 Representative data of X-chromosome inactivation (XCI) assays at PGK (A) and AR loci (B and C).
Nonrandom XCI are present in HCAs (08 in A, 20 in B) and HCCs (09, 21 and 22 in A, 08 in C), revealing their monoclonality. A: The G/A single-nucleotide polymorphism at PGK exon 1 was demonstrated by BstXI-digestion and electrophoresis on an agarose gel. The intact and cleaved amplification products migrate at positions of 530 (upper band) and 433 bp (lower band), respectively. Pretreatment with HpaII (-: Before; +: After) resulted in marked reduction of the lower band in single tumor samples (T) and separate tumor areas (TA), but not in the surrounding liver parenchyma (N). M: DNA markers, with five bands at locations of 700, 600, 500, 400 and 300 bp; B and C: The length polymorphism of AR gene was resolved on a 10% polyacrylamide gel containing urea (8 mol/L) and visualized by silver staining, with one product migrating faster than the other. Pretreatment with HhaI (-: Before; +: After) resulted in loss or marked reduction of one band in tumor samples, but not in the non-neoplastic tissue. M: DNA marker at the location of 200 bp.
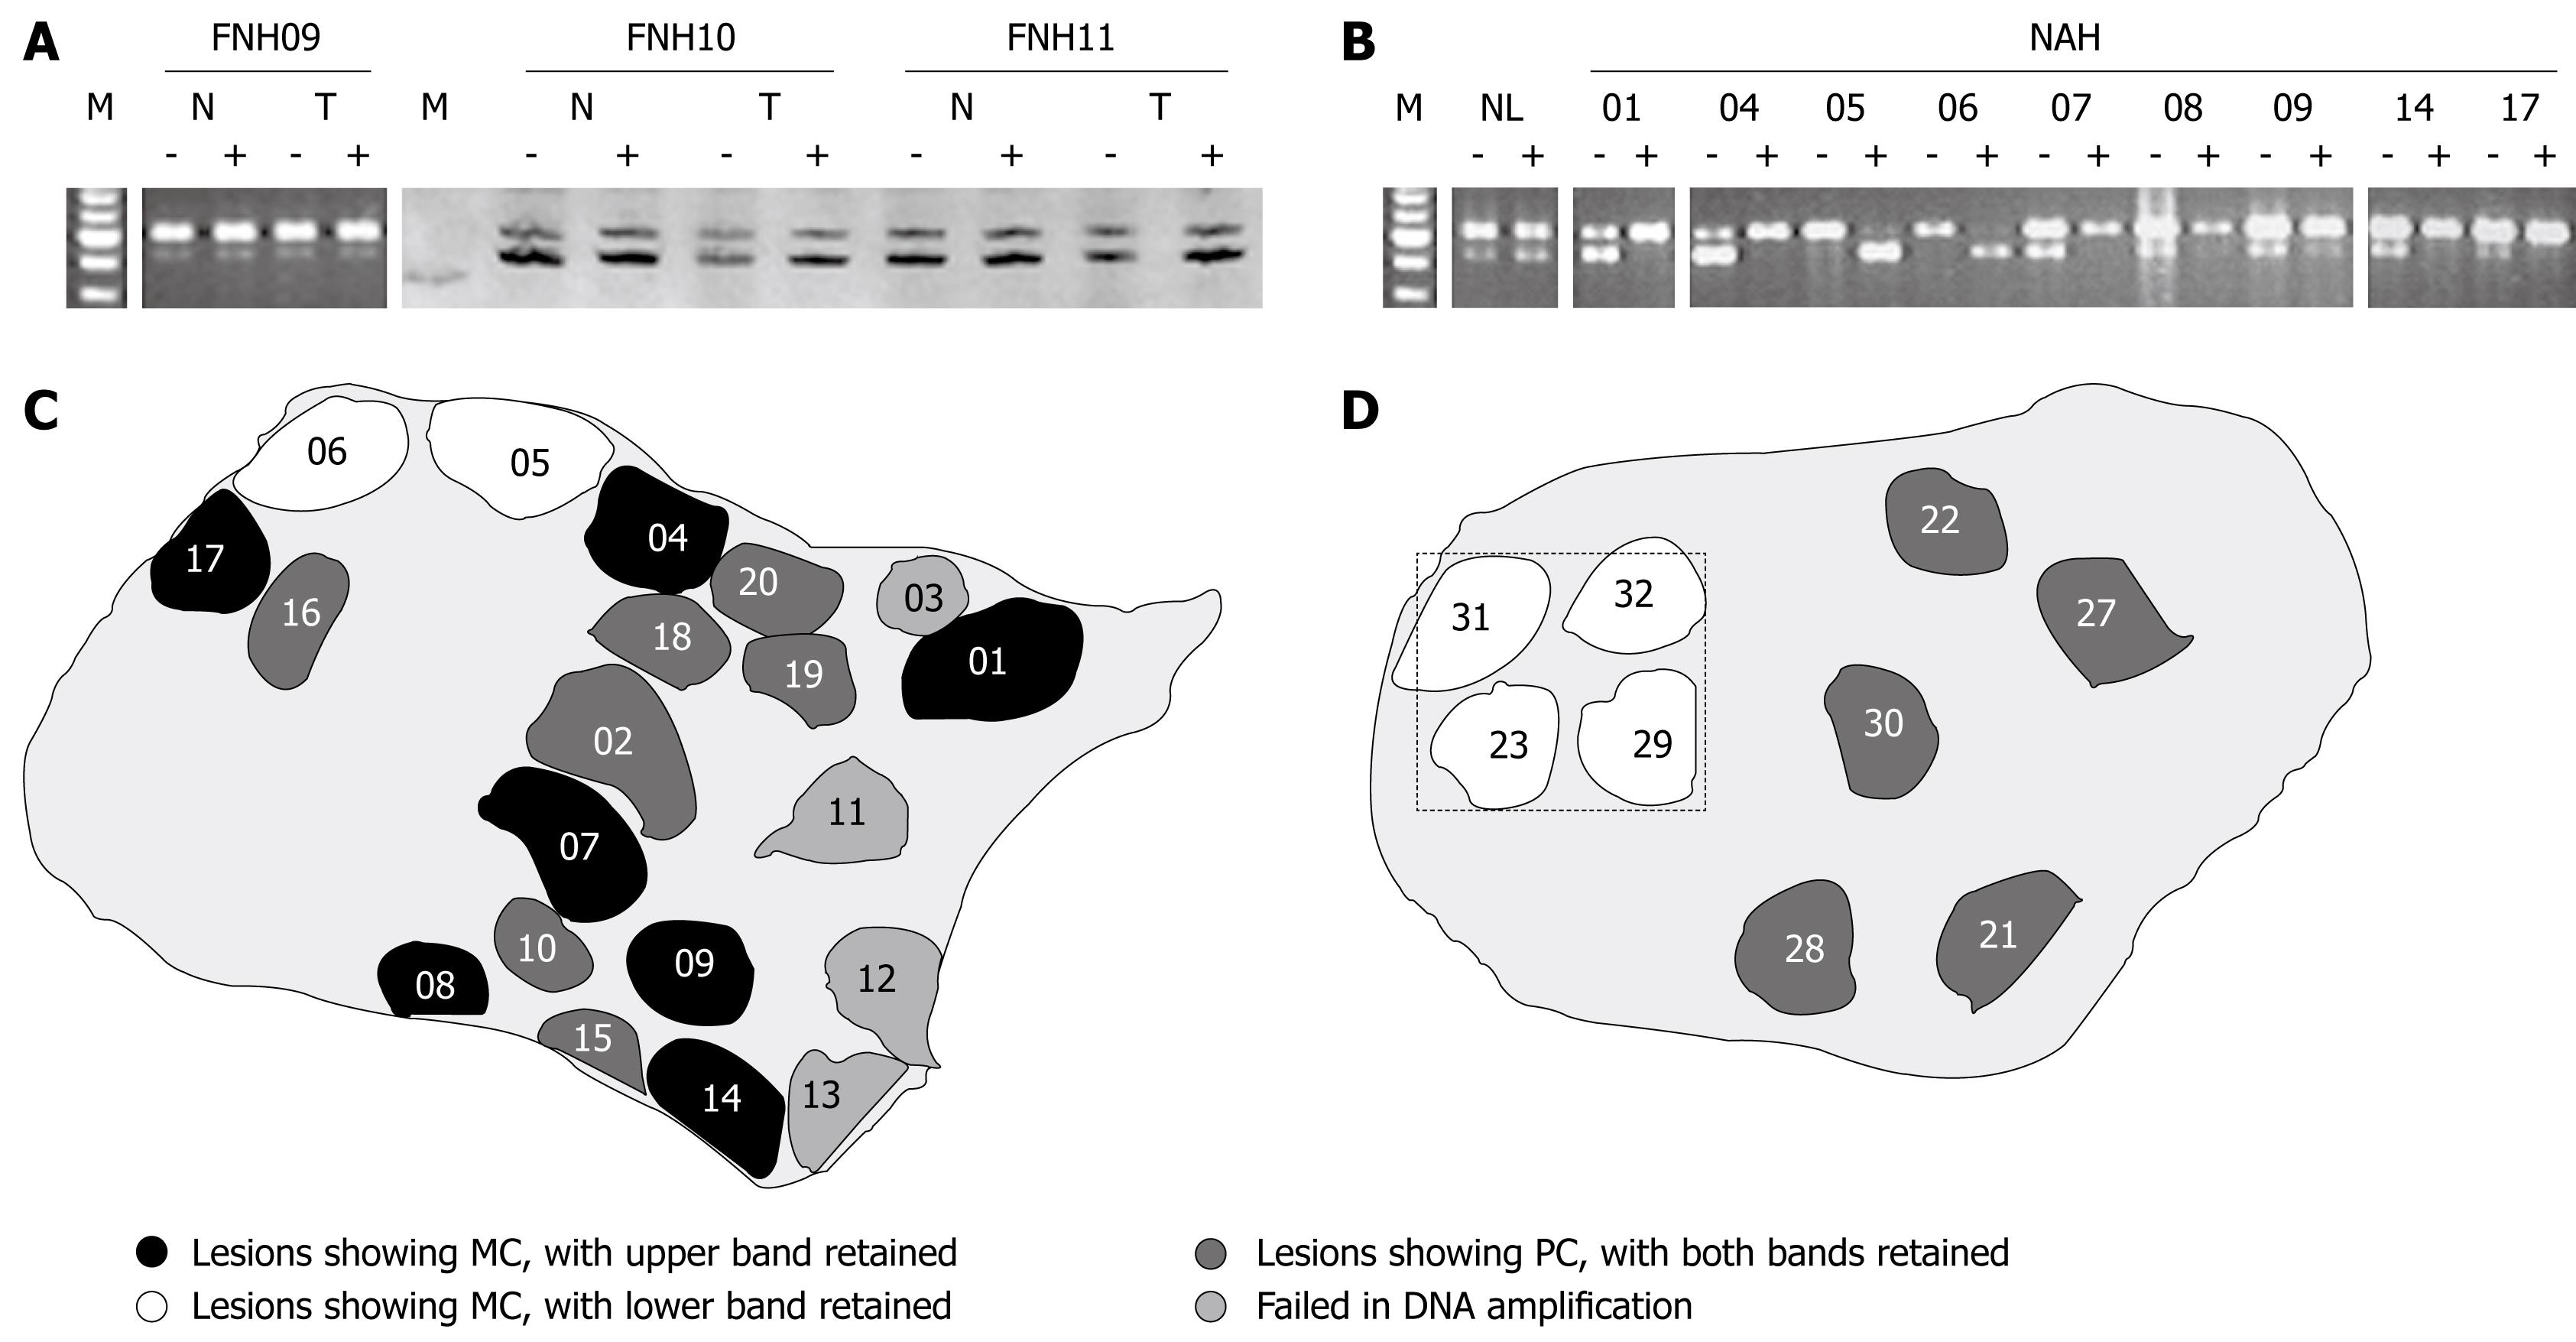
Figure 3 Clonality status of FNH lesions (A) and NAH (B), with XCI patterns revealed in different NAH (C and D).
A: Polyclonality (PC) revealed in 3 FNH lesions, with FNH09 assayed at PGK locus and 10 and 11 at AR locus. HpaII or HhaI pretreatment (-: Before; +: After) did not significantly change intensity ratios between the two bands of lesional tissues (T) compared to those of the surrounding liver parenchyma (N). M: DNA markers, with five bands at locations of 700, 600, 500, 400 and 300 bp for PGK assay, and a single band at the location of 200 bp for AR reaction; B: The PGK assay shows monoclonality (MC) in all of the nine NAH from FNH09, with the isolated reference tissue sample (NL), of a similar size to NAH, revealing polyclonality. XCI patterns of the NAH are different, with the upper band retained in NAH 01, 04, 07-09, 14 and 17, and the lower band retained in NAH 05 and 06; C: Sketch of a tissue section from FNH09, as illustrated in B, showing occurrence of monoclonal NAH with different XCI patterns and polyclonal lesions in the same section; D: Sketch of a tissue section from FNH11, showing four monoclonal and five polyclonal NAH. The clustered monoclonal lesions show the same XCI pattern, the XCI assays with small samples, as framed by hatch lines, may result in misinterpretation as monoclonality for the whole FNH lesion.
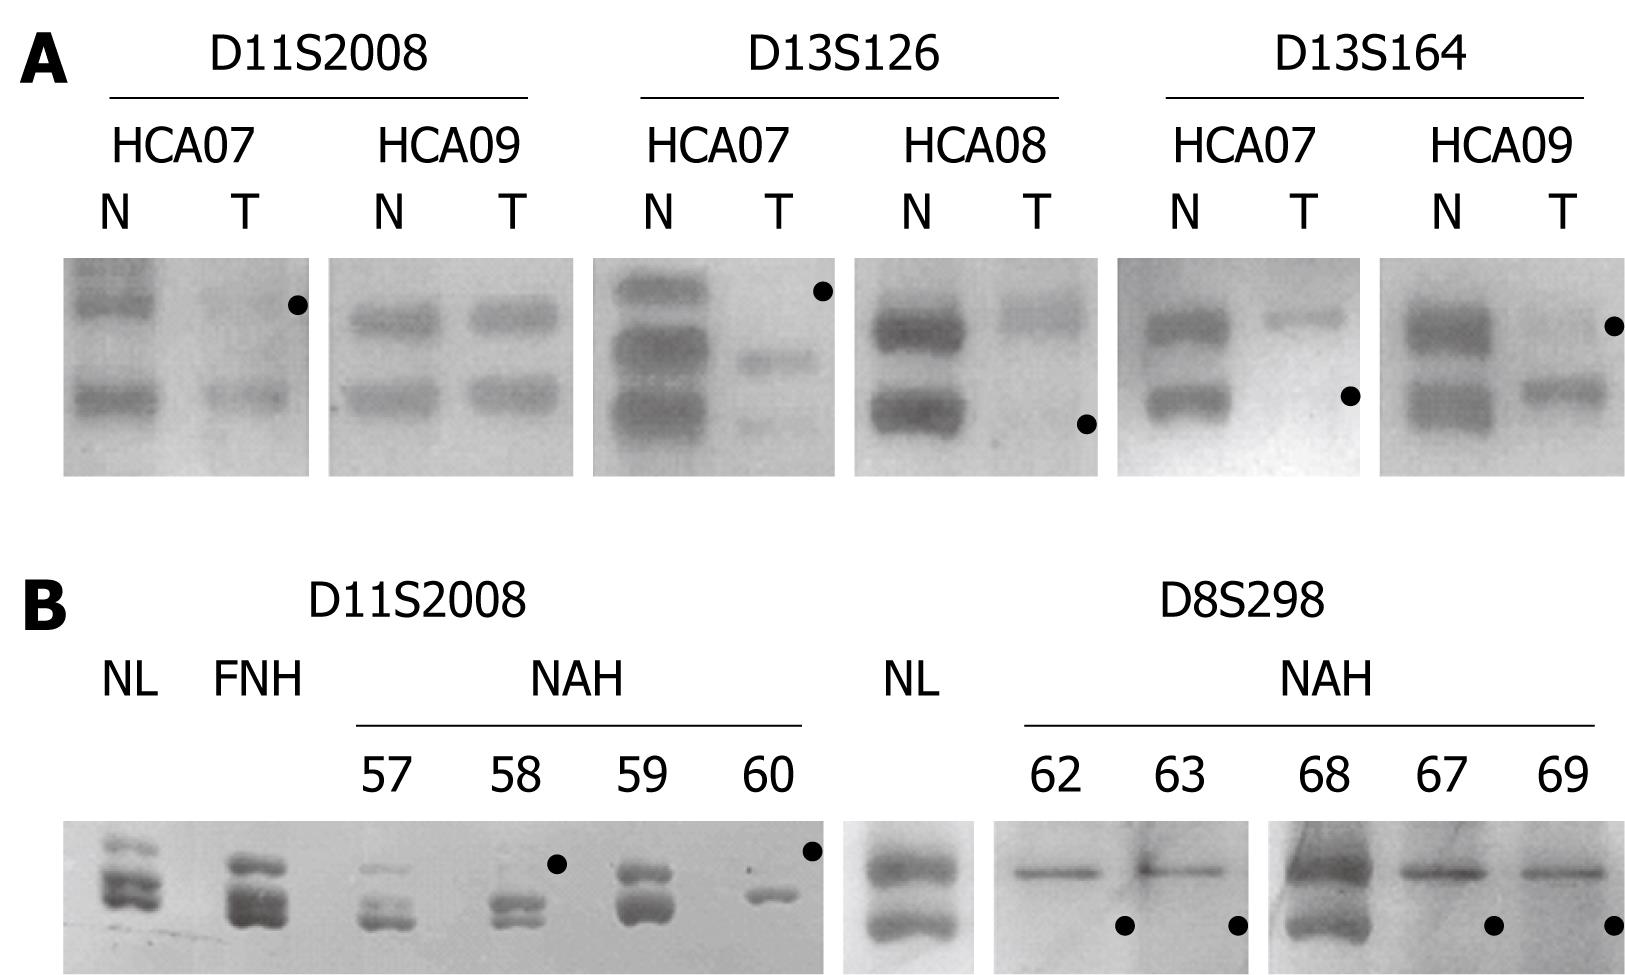
Figure 4 Representative data of amplification products at three length-polymorphic loci in HCAs 07-09 (A), FNH04 and NAH microdissected from the FNH lesion (B), with loss or marked reduction of the product from one allele (black dot) defined as LOH.
A: Gels show the allelic imbalance at D11S2008, D13S164 and D13S164 in HCA07, at D13S126 in HCA08, at D13S164, but not in D11S2008, in HCA09 (T: Tumor; N: Peritumorous normal liver); B: The microdissected lesions NAH58 and NAH60, but not NAH57 and NAH59, show LOH at D11S2008. The lesions NAH62, NAH63, NAH67 and NAH69, but not NAH68, show LOH at D8S298. Both alleles are preserved in FNH04 as tested as a whole (FNH) and compared to those of the surrounding normal liver parenchyma (NL).
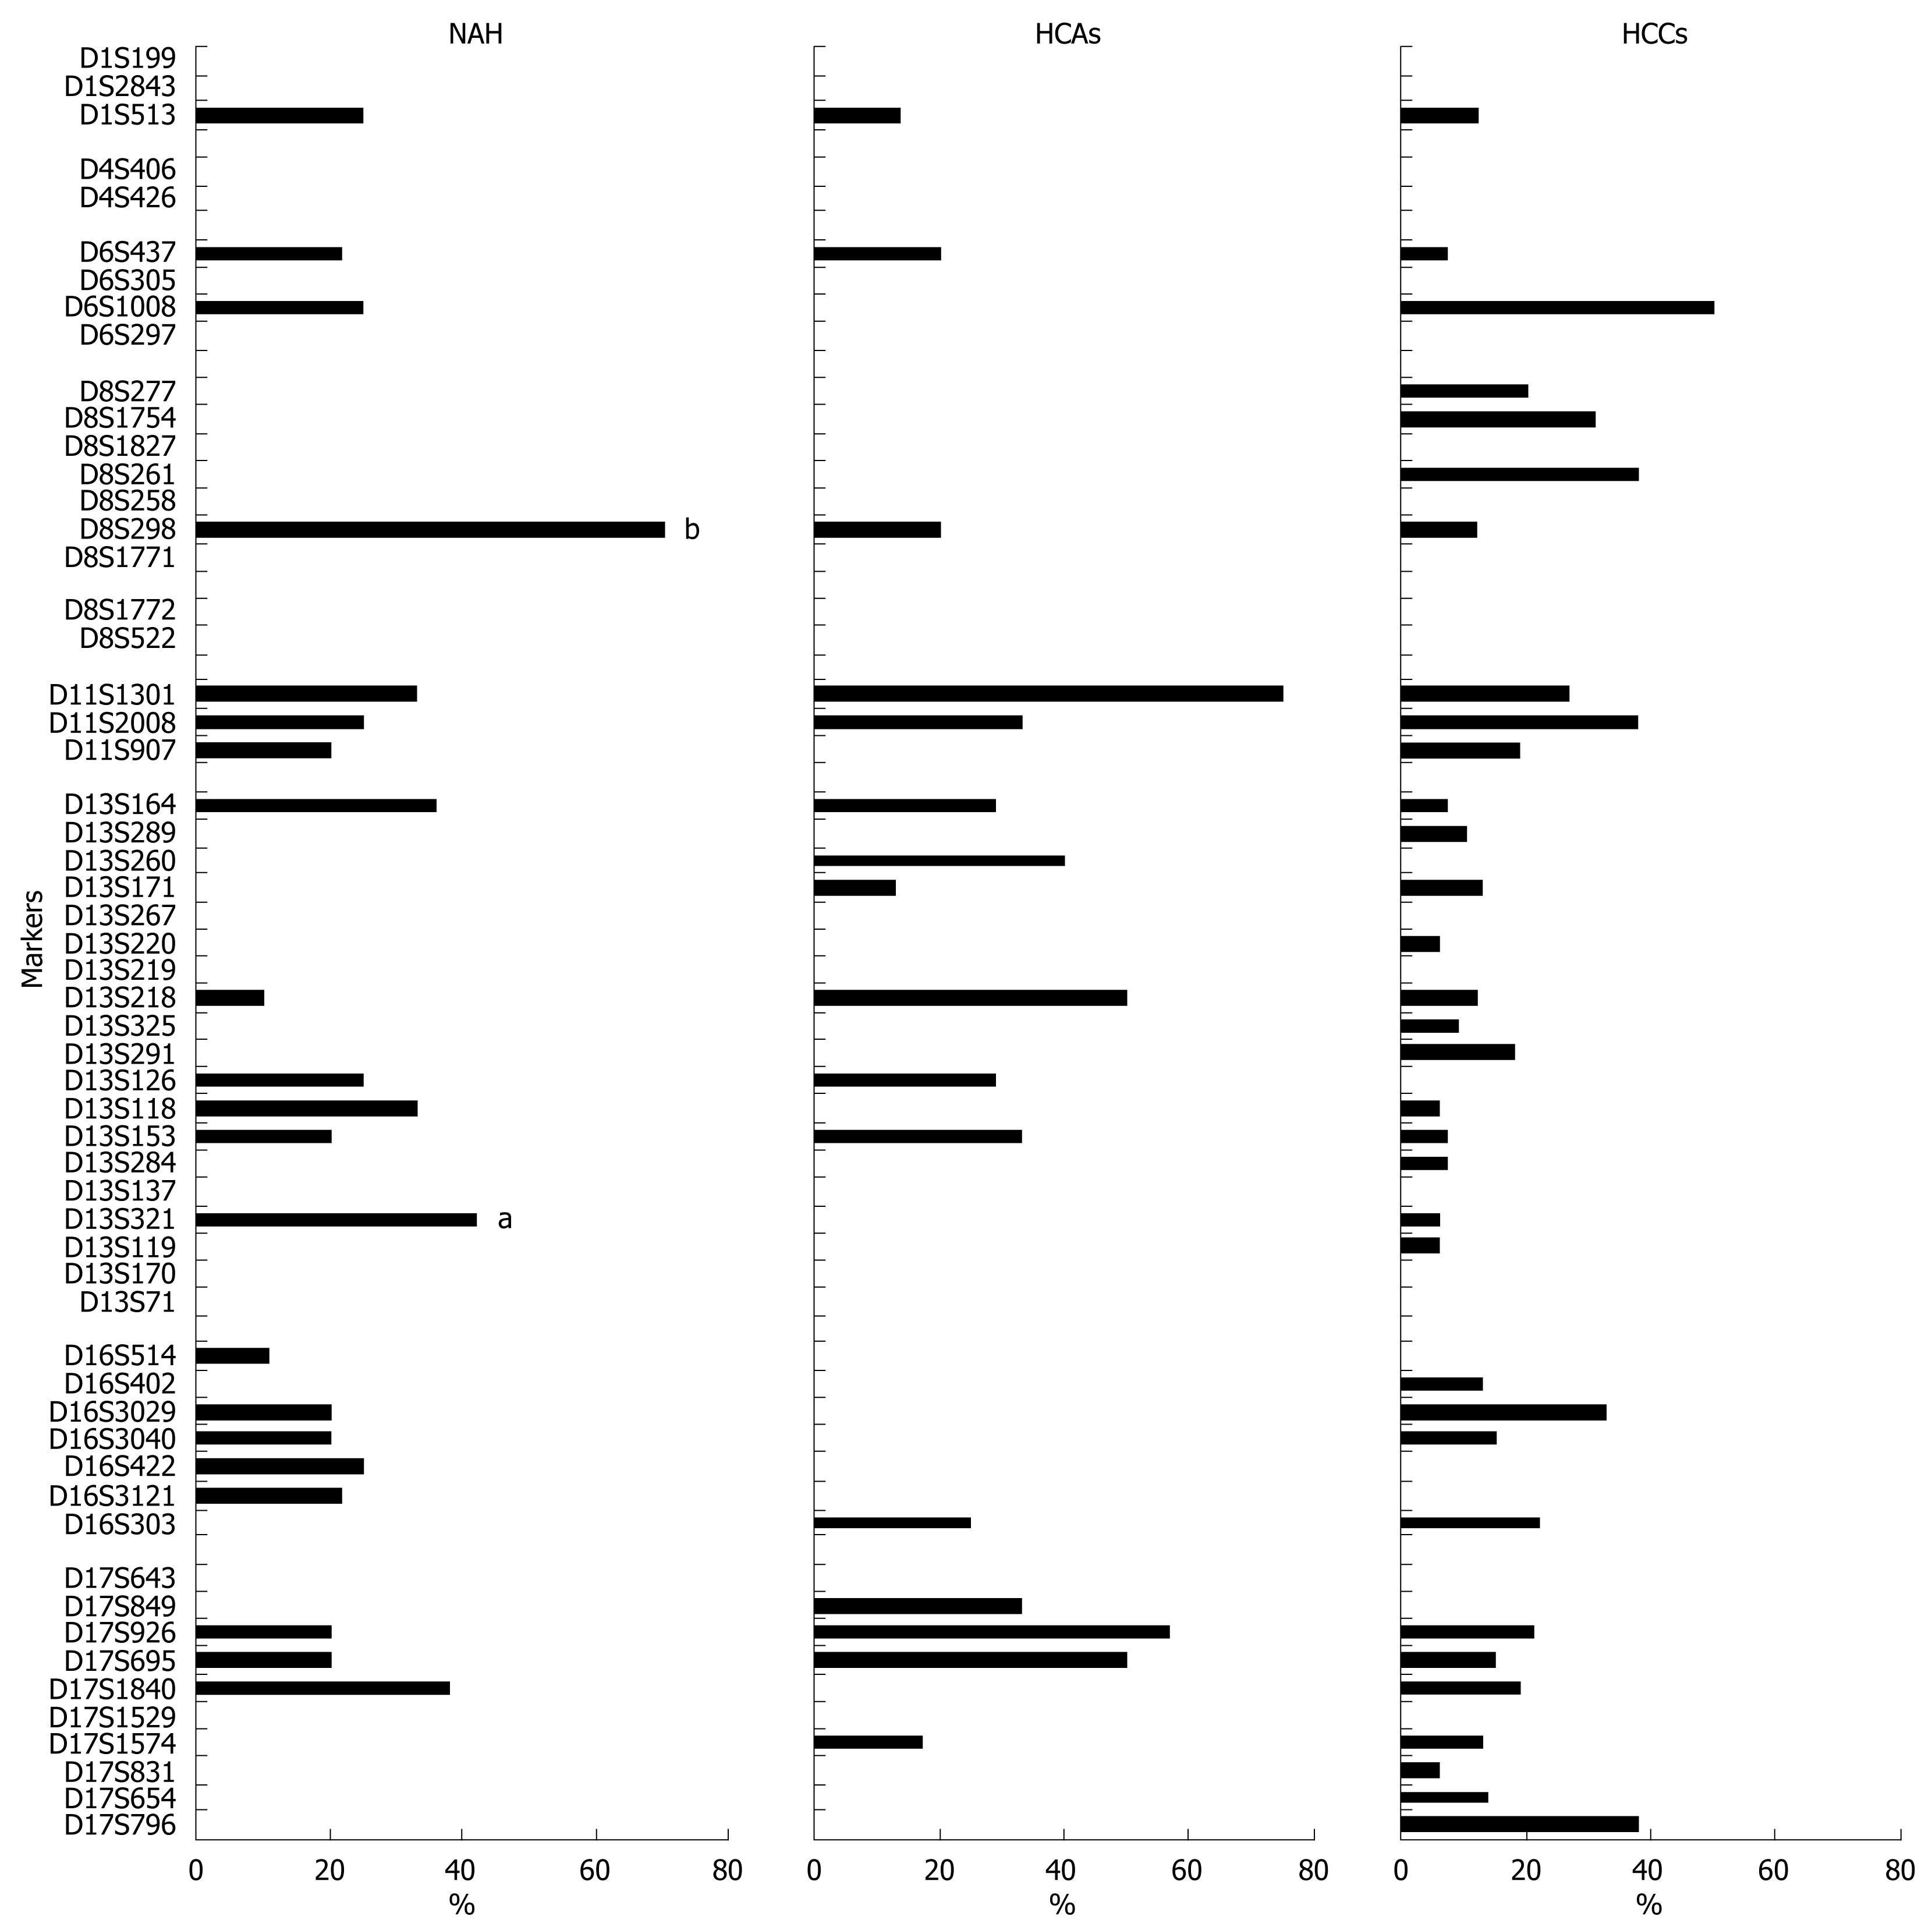
Figure 5 Frequencies of LOH as demonstrated using 57 microsatellite markers in NAH (n = 13), HCAs (n = 9) and well-differentiated HCCs (n = 18).
aP < 0.05, bP < 0.01 vs HCCs.
- Citation: Cai YR, Gong L, Teng XY, Zhang HT, Wang CF, Wei GL, Guo L, Ding F, Liu ZH, Pan QJ, Su Q. Clonality and allelotype analyses of focal nodular hyperplasia compared with hepatocellular adenoma and carcinoma. World J Gastroenterol 2009; 15(37): 4695-4708
- URL: https://www.wjgnet.com/1007-9327/full/v15/i37/4695.htm
- DOI: https://dx.doi.org/10.3748/wjg.15.4695


