Copyright
©2009 The WJG Press and Baishideng.
World J Gastroenterol. Jul 21, 2009; 15(27): 3440-3444
Published online Jul 21, 2009. doi: 10.3748/wjg.15.3440
Published online Jul 21, 2009. doi: 10.3748/wjg.15.3440
Figure 1 Radiologic finding of hilar bile duct cancer.
A: Dynamic abdominal CT during arterial phase of axial image showed a low-density mass, 1.7 cm in diameter at the hilum of the liver, extending to the right intrahepatic bile duct (arrow) and intrahepatic bile duct dilatation in the right lobe (arrow head); B: Dynamic abdominal CT during venous phase of coronal image showed the mass extending to the second branch of the intrahepatic bile duct in right hepatic lobe (arrow); C: T2WI, axial image of MRI showed the mass located in the perihilar bile duct with the same signs of liver parenchyma (arrow), and extending to the second branch of the intrahepatic bile duct in the right hepatic lobe.
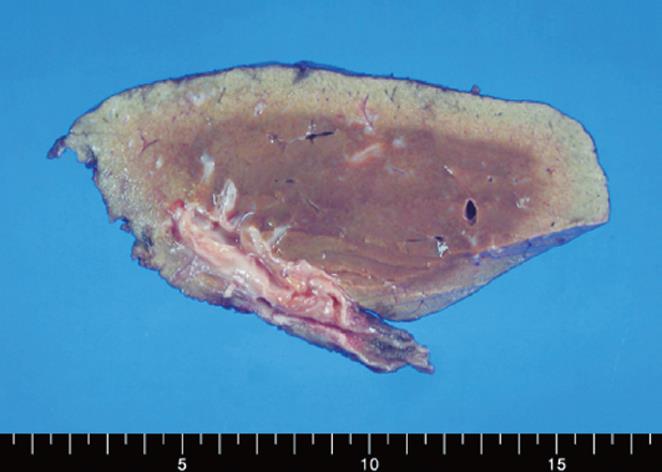
Figure 2 Gross specimen of bile duct excision and right hepatic lobectomy.
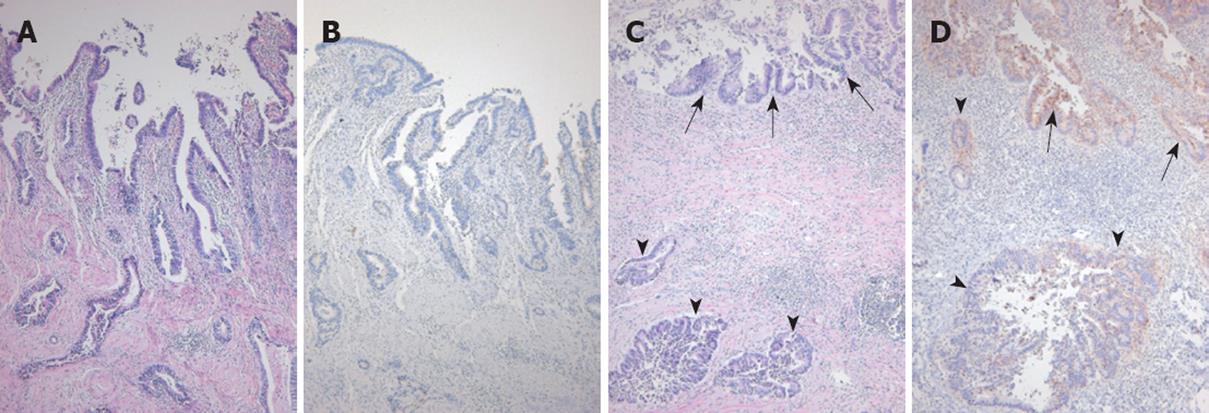
Figure 3 Histopathological finding of hilar bile duct cancer.
A: Histologic section of the gallbladder shows well-differentiated biliary-type adenocarcinoma infiltrating the entire thickness of the gallbladder wall (HE, × 100); B: None of the tumor cells expressed CA19-9 (immunoperoxidase method, × 100); C: Histologic section of the hepatic duct demonstrates severe epithelial dysplasia of the mucosa in the upper field (arrows) and invasive adenocarcinoma in the lower field (arrow heads) (hematoxylin and eosin, × 100); D: Most of the dysplastic epithelial cells in the upper field (arrows) and some of invasive tumor cells in the lower field express cytoplasmic CA19-9 (arrow heads). An invasive tumor gland is noted in the mid-left field (immunoperoxidase method, × 100).
- Citation: Joo HJ, Kim GH, Jeon WJ, Chae HB, Park SM, Youn SJ, Choi JW, Sung R. Metachronous bile duct cancer nine years after resection of gallbladder cancer. World J Gastroenterol 2009; 15(27): 3440-3444
- URL: https://www.wjgnet.com/1007-9327/full/v15/i27/3440.htm
- DOI: https://dx.doi.org/10.3748/wjg.15.3440


