Copyright
©2008 The WJG Press and Baishideng.
World J Gastroenterol. Dec 7, 2008; 14(45): 6936-6942
Published online Dec 7, 2008. doi: 10.3748/wjg.14.6936
Published online Dec 7, 2008. doi: 10.3748/wjg.14.6936
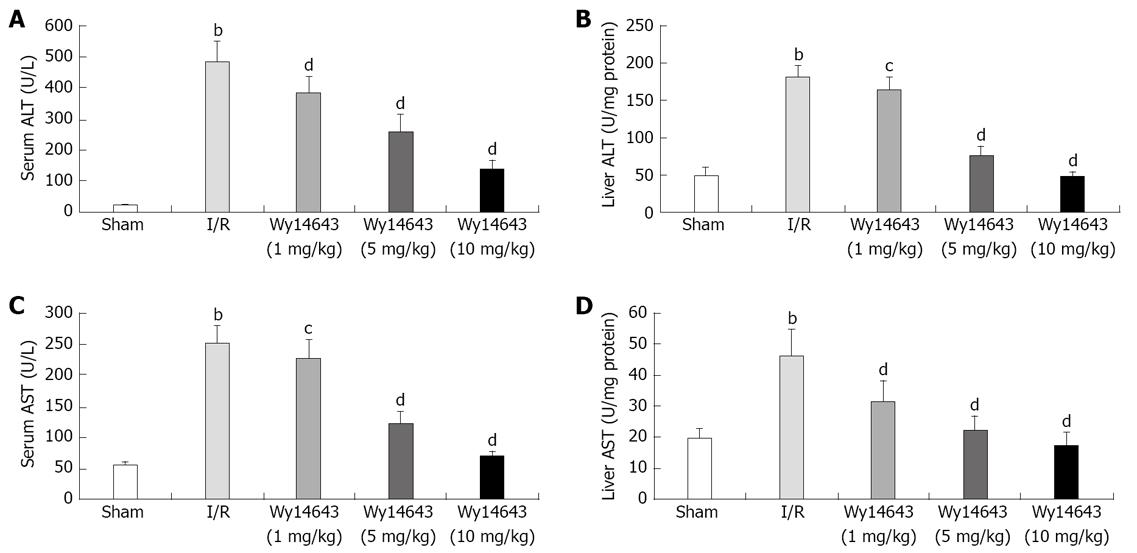
Figure 1 Levels of serum and liver tissue homogenate ALT and AST.
Serum ALT (A), liver ALT (B), serum AST (C) and liver AST (D) levels in different groups (mean ± SD, n = 6). After 90 min of hepatic ischemia and 4 h of reperfusion, ALT and AST were determined with an ALT and AST assay kit. bP < 0.01 vs sham group; cP < 0.05, dP < 0.01 vs I/R group.
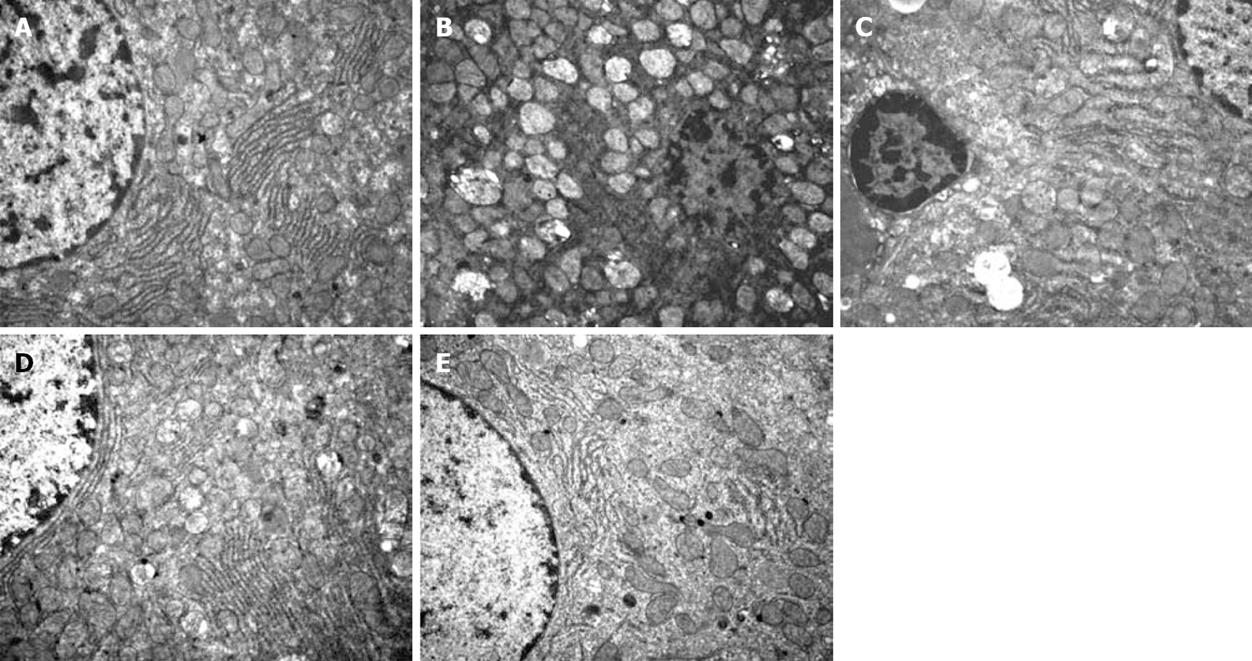
Figure 2 Ultrastructural alterations of liver tissue.
A: Sham group. Normal appearance of mitochondrion, rough endoplasmic reticulum and nucleus structure; B: I/R group. Mitochondrion swelled significantly with vacuolar degeneration and mitochondrial crista destruction, marked decrease of rough endoplasmic reticulum and nucleus structure destruction; C: Wy14643 group (1 mg/kg). Mitochondrion swelled moderately, with mitochondrial crista interruption and vacuolar degeneration, increase of rough endoplasmic reticulum and nucleus structure destruction; D: Wy14643 group (5 mg/kg). Mitochondrion swelled mildly, with rough endoplasmic reticulu and normal nucleus structure; E: Wy14643 group (10 mg/kg). Normal appearance of mitochondrion, rough endoplasmic reticulum and nucleus structure.
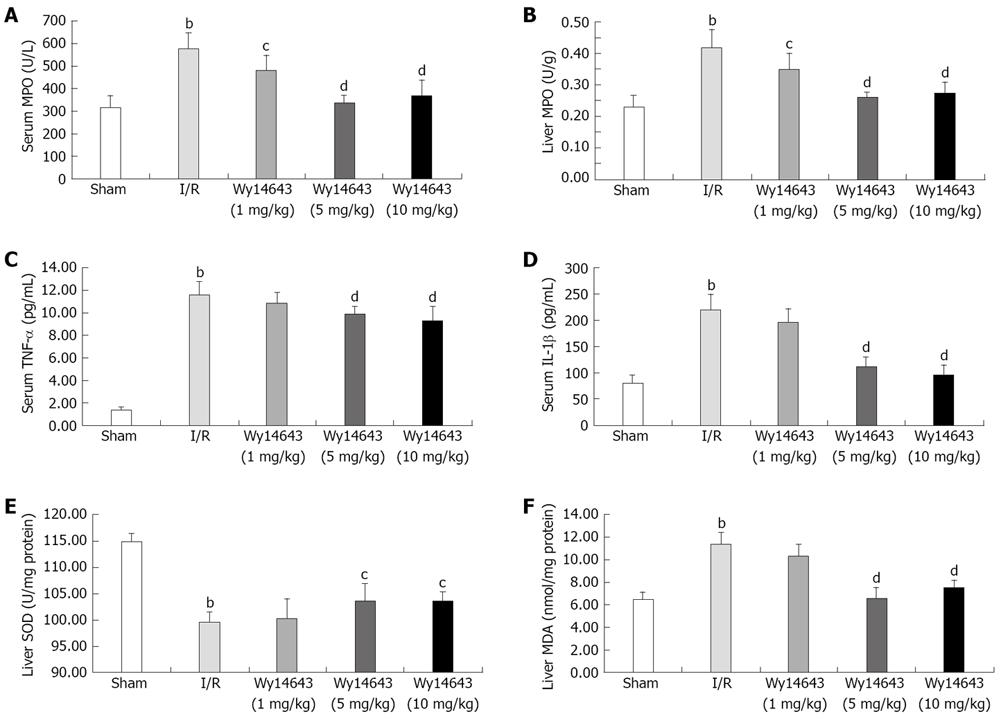
Figure 3 Activities of MPO in the serum (A), activities of MPO in the liver (B), serum TNF-α levels (C), serum IL-1β levels (D), activity of SOD in the liver (E) and content of MDA in the liver (F) in different groups (mean ± SD, n = 6).
After 90 min of hepatic ischemia and 4 h of reperfusion, MPO, TNF-α, IL-1β, SOD and MDA were analyzed with an MPO, TNF-α, IL-1β, SOD and MDA assay kit. bP < 0.01 vs sham group; cP < 0.05, dP < 0.01 vs I/R group.
- Citation: Xu SQ, Li YH, Hu SH, Chen K, Dong LY. Effects of Wy14643 on hepatic ischemia reperfusion injury in rats. World J Gastroenterol 2008; 14(45): 6936-6942
- URL: https://www.wjgnet.com/1007-9327/full/v14/i45/6936.htm
- DOI: https://dx.doi.org/10.3748/wjg.14.6936


