Copyright
©2008 The WJG Press and Baishideng.
World J Gastroenterol. Nov 21, 2008; 14(43): 6681-6688
Published online Nov 21, 2008. doi: 10.3748/wjg.14.6681
Published online Nov 21, 2008. doi: 10.3748/wjg.14.6681
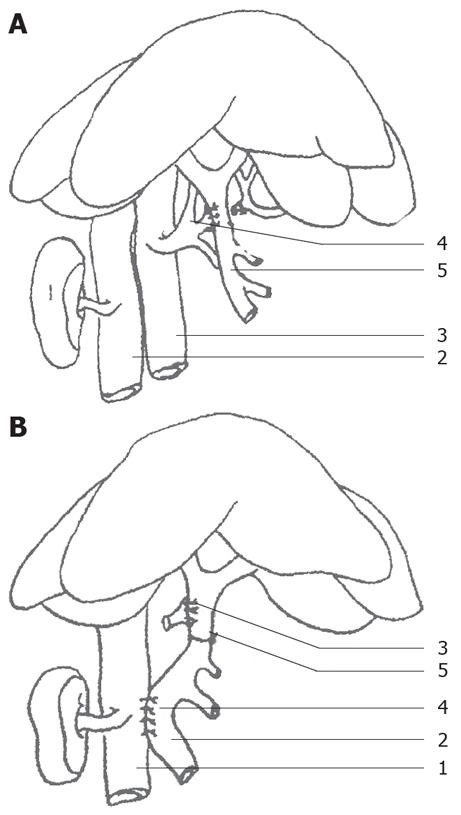
Figure 1 Animal PVA model establishment.
A: Side-to-side anastomotic stoma of the hepatic artery and the portal vein. (1) kidney; (2) inferior vena cava; (3) abdominal aorta; (4) hepatic artery; (5) portal vein. B: Side-to-side anastomotic stoma of the portal vein and the venae cavae. (1) inferior vena cava; (2) portal vein; (3) arteriovenous anastomotic stoma; (4) anastomotic stoma of the portal vein and the venae cavae; (5) ligation of the portal vein.
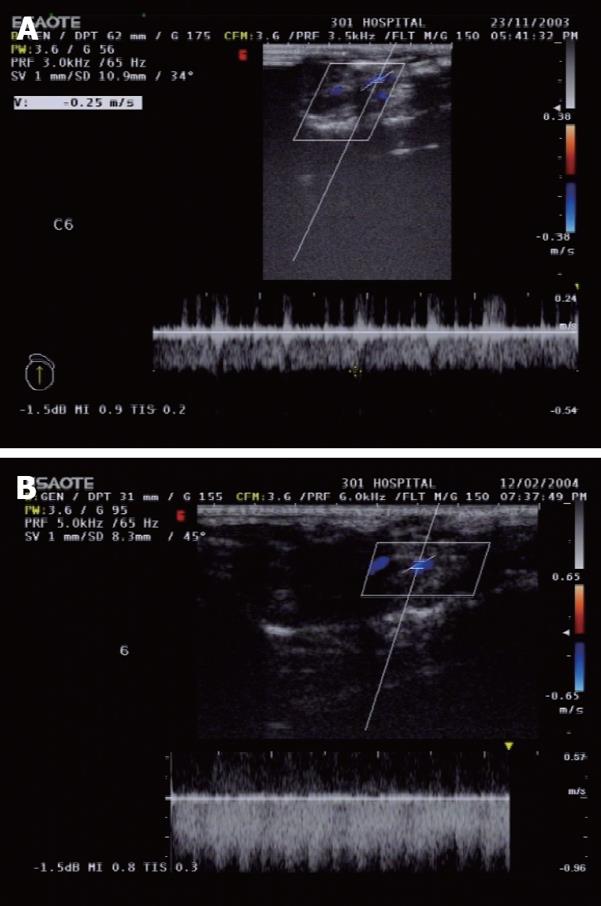
Figure 2 Frequency spectrums in the portal vein.
A: Venous frequency spectrums in the portal vein of control group; B: Arterial frequency spectrums in the portal vein 6 mo after PVA.
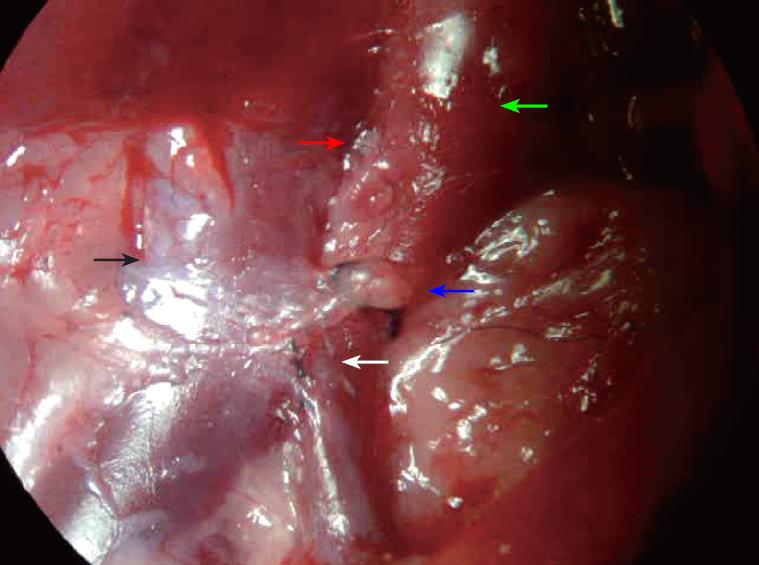
Figure 3 The status of the vascular anastomosis of the portal vein with hepatic artery and vena cava.
The red arrow indicates the anastomotic site of the hepatic artery and portal vein. The white arrow indicates the side-to-side anastomotic stoma of the portal vein and the venae cavae. The green arrow indicates thickening of the portal vein. The black arrow indicates the venae cavae. The blue arrow indicates a thread blocking the portal vein.
Figure 4 PVP plane structure of hepatohilar bile duct.
A: Control group (20 μm, × 100); B: PVA group (20 μm, × 100).
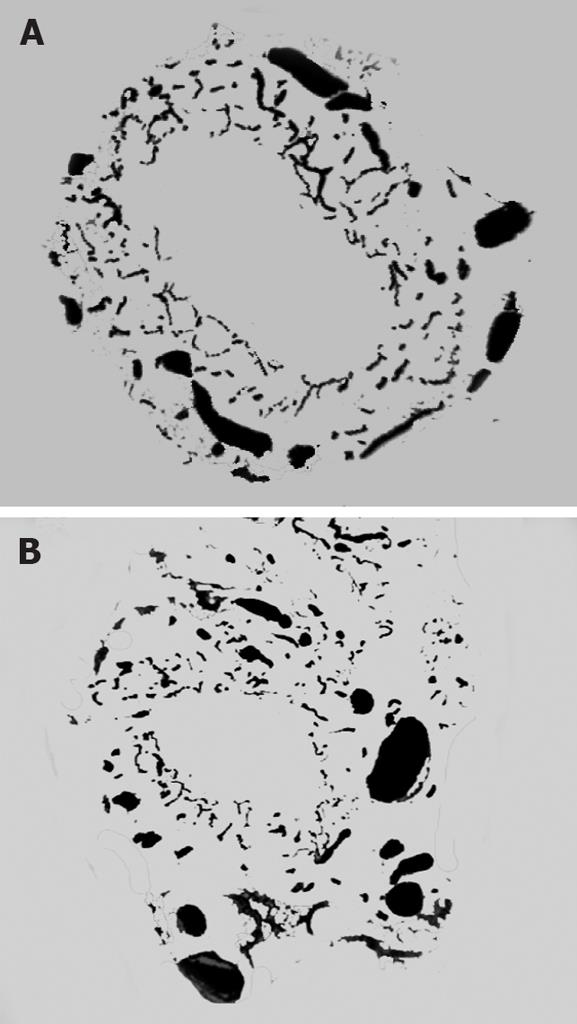
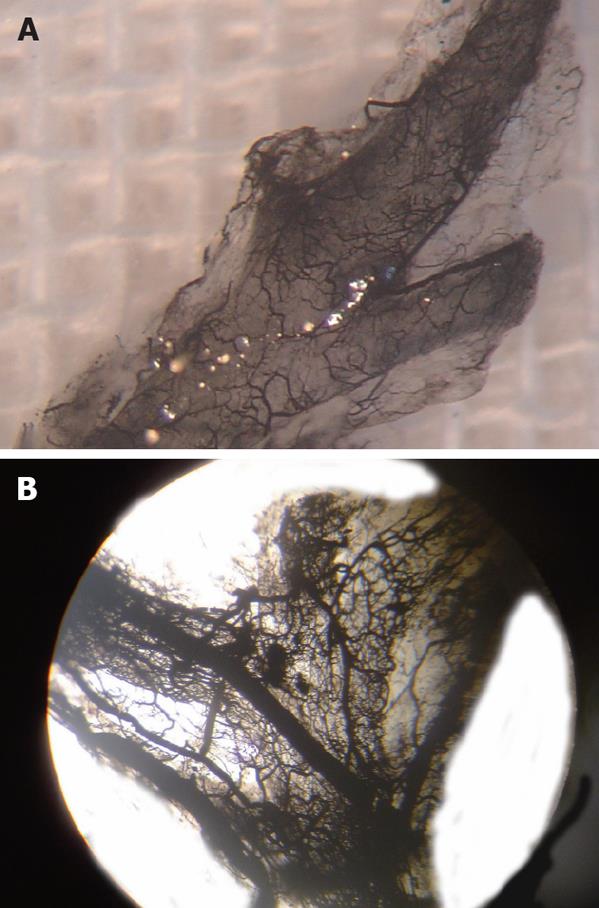
Figure 5 Microvascular distribution in forked site of hepatohilar bile ducts.
A: Control group (× 100); B: PVA group (× 100).
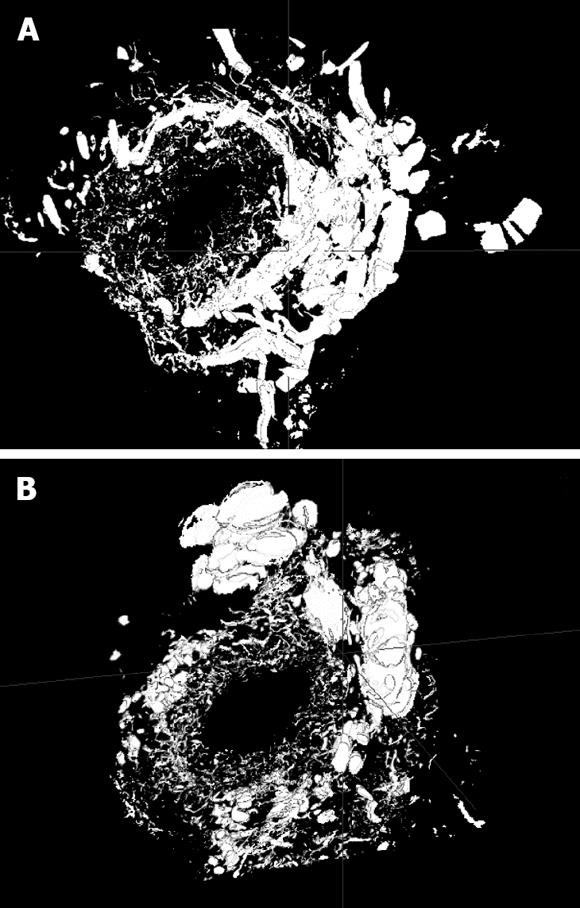
Figure 6 PVP three-dimensional reconstruction of hepatohilar bile ducts.
A: Control group (12 × 20 μm); B: PVA group (12 × 20 μm).
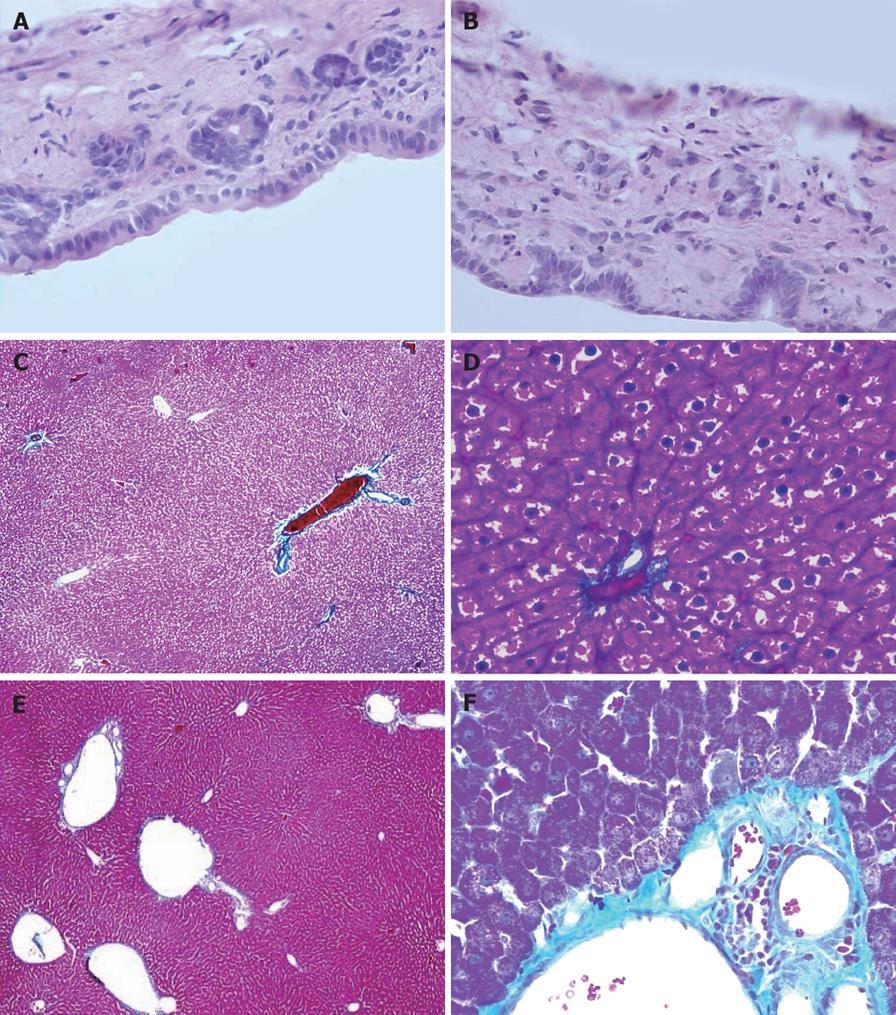
Figure 7 The pathological changes of hepatohilar bile duct and the liver in rats 6 mo after PVA using HE staining and Masson staining.
A: Hepatohilar bile ducts in control group (HE, × 400); B: Hepatohilar bile ducts in PVA group (HE, × 400). C: Masson staining of the liver 6 mo after operation in control group (× 40); D: Masson staining of the liver 6 mo after operation in control group (× 400). E: Masson staining of the liver 6 mo after PVA in PVA group (× 40); F: Masson staining of the liver 6 mo after PVA in PVA group (× 400).
- Citation: Li WG, Chen YL, Chen JX, Qu L, Xue BD, Peng ZH, Huang ZQ. Portal venous arterialization resulting in increased portal inflow and portal vein wall thickness in rats. World J Gastroenterol 2008; 14(43): 6681-6688
- URL: https://www.wjgnet.com/1007-9327/full/v14/i43/6681.htm
- DOI: https://dx.doi.org/10.3748/wjg.14.6681


