Copyright
©2008 The WJG Press and Baishideng.
World J Gastroenterol. Oct 7, 2008; 14(37): 5683-5688
Published online Oct 7, 2008. doi: 10.3748/wjg.14.5683
Published online Oct 7, 2008. doi: 10.3748/wjg.14.5683
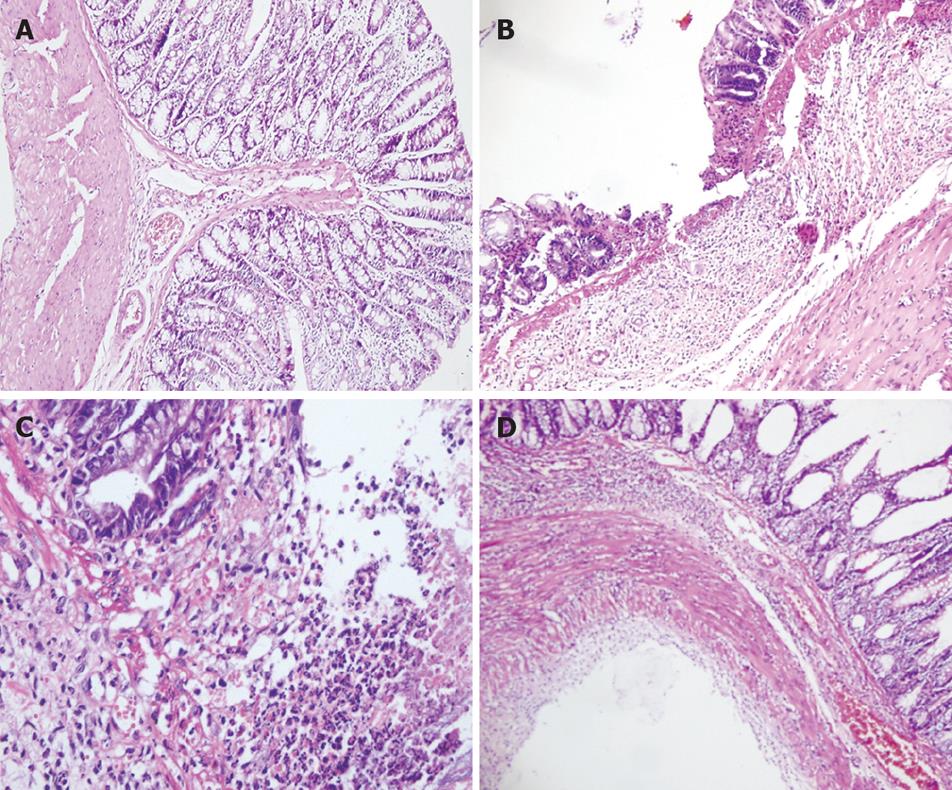
Figure 1 Pathological change under light microscopy (HE staining, × 400) in normal control group (A), model group (B), protective group A (C), and protective group B (D).
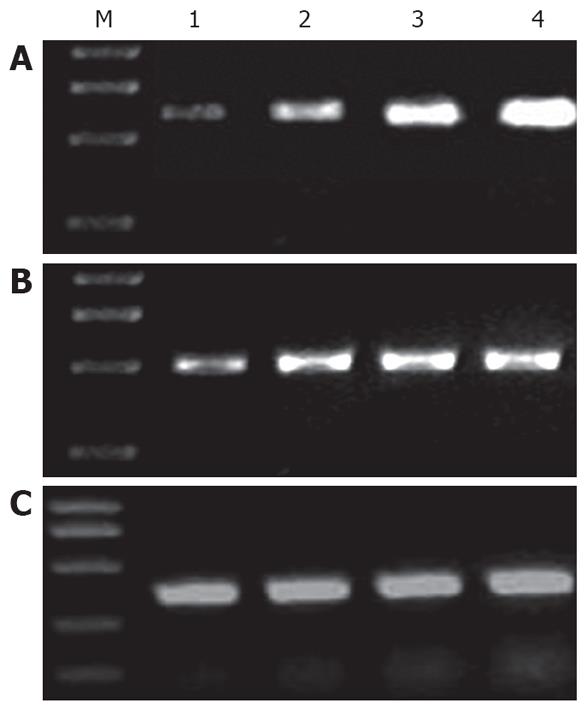
Figure 2 RT-PCR for MMP-1 (A), TIMP-1 (B) and β-actin (C).
M: marker; lane1: normal controls; lane 2: protective group B; lane 3: protective group A; lane 4: UC model group.
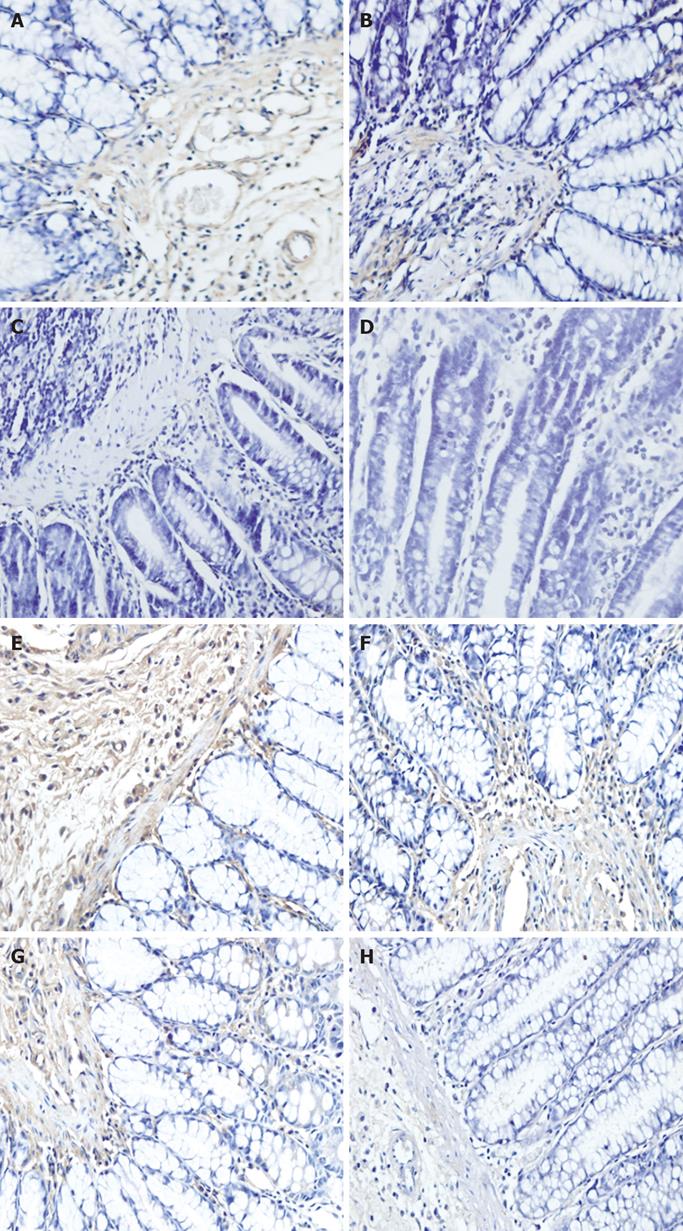
Figure 3 Immunohistochemistry showing MMP-1 in model group (A, E), protective group A (B, F), protective group B (C, G), normal control group (D, H).
- Citation: Wang YD, Wang W. Protective effect of ilomastat on trinitrobenzenesulfonic acid-induced ulcerative colitis in rats. World J Gastroenterol 2008; 14(37): 5683-5688
- URL: https://www.wjgnet.com/1007-9327/full/v14/i37/5683.htm
- DOI: https://dx.doi.org/10.3748/wjg.14.5683


