Copyright
©2008 The WJG Press and Baishideng.
World J Gastroenterol. Sep 28, 2008; 14(36): 5557-5563
Published online Sep 28, 2008. doi: 10.3748/wjg.14.5557
Published online Sep 28, 2008. doi: 10.3748/wjg.14.5557
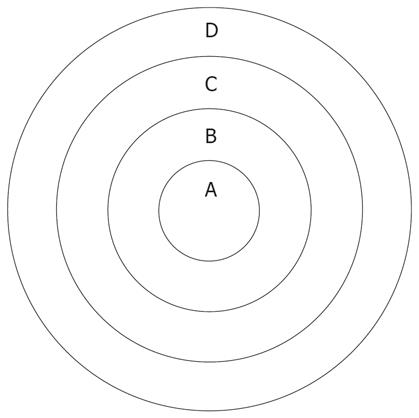
Figure 1 A-D represent VX-2 tumor center, VX-2 tumor periphery, VX-2 tumor outer layer and normal liver parenchyma around tumor respectively.
The ADC levels and signal were measured on DWI, and the samples were investigated by histopathology.
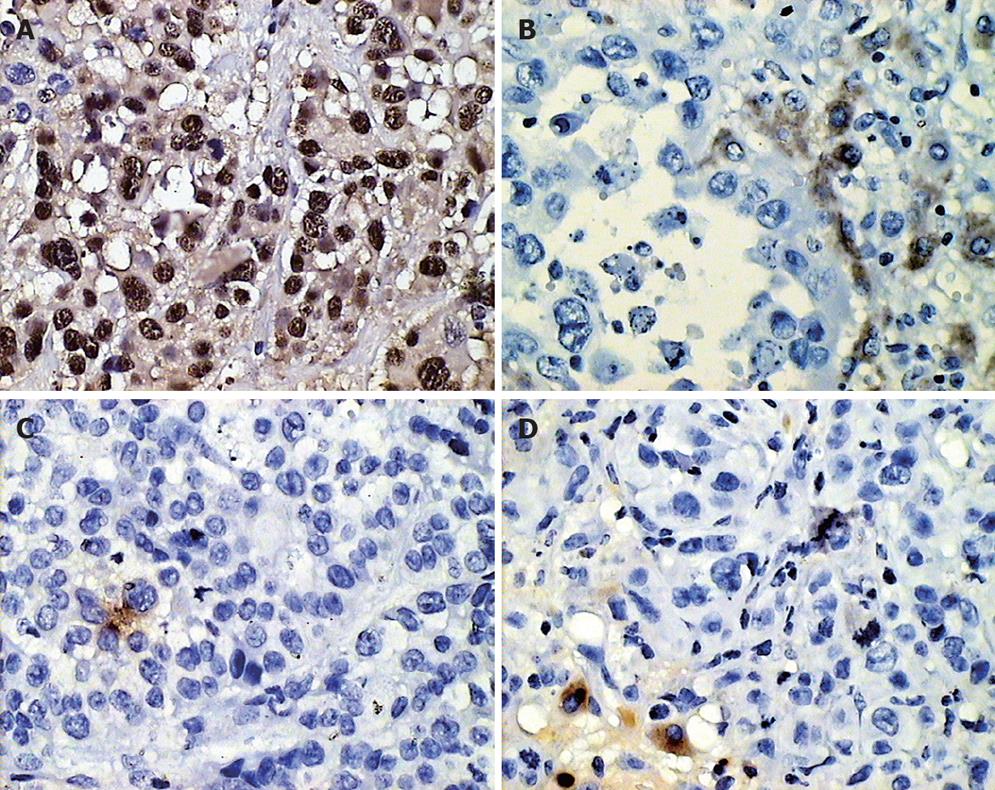
Figure 2 Positive gene expression in VX-2 tumor.
A: PCNA; B: Bax; C: nm23; D: E-cad.
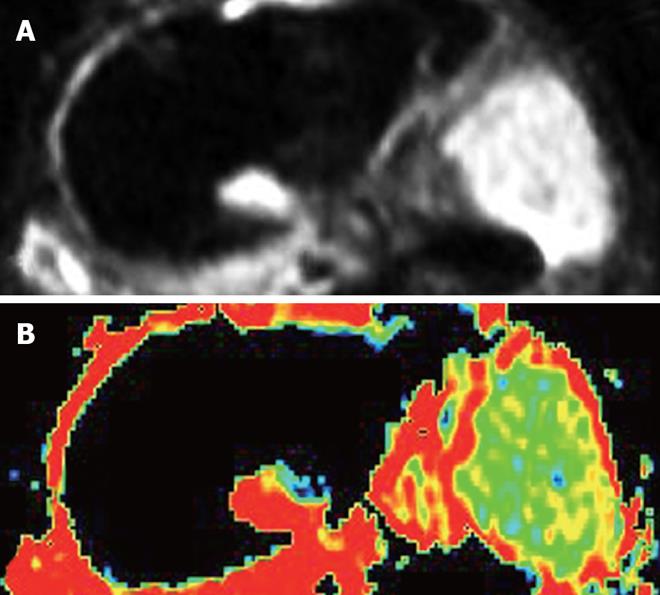
Figure 3 Image manifestations of hepatic VX-2 tumor on DWI and ADC map when b-value was 100 s/mm2, 6 h after chemoembolization.
A: High signal and distinct margins of VX-2 tumor on DWI; B: Low signal on the ADC map.
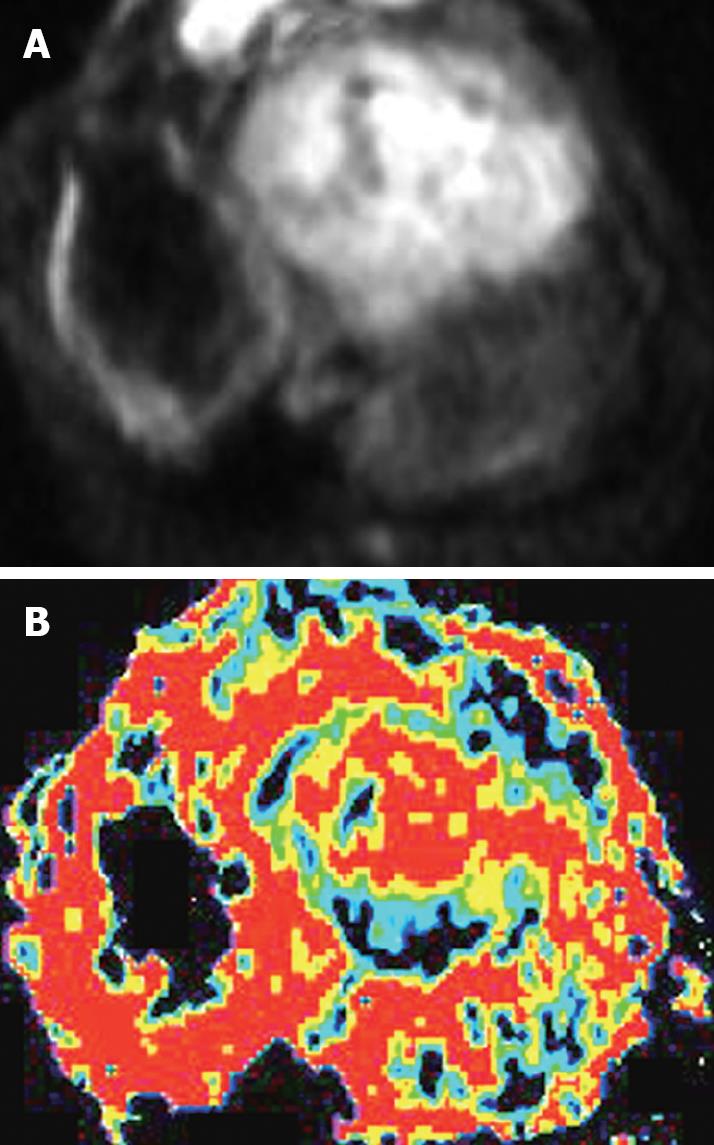
Figure 4 High uneven signal and distinct margins of hepatic VX-2 tumor on DWI and ADC map when b-value was 100 s/mm2, 32 h after chemoembolization.
A: High and uneven signal and distinct margins on DWI; B: Low or equal signal on ADC map.
- Citation: Yuan YH, Xiao EH, Liu JB, He Z, Jin K, Ma C, Xiang J, Xiao JH, Chen WJ. Gene expression and MR diffusion-weighted imaging after chemoembolization in rabbit liver VX-2 tumor model. World J Gastroenterol 2008; 14(36): 5557-5563
- URL: https://www.wjgnet.com/1007-9327/full/v14/i36/5557.htm
- DOI: https://dx.doi.org/10.3748/wjg.14.5557


