Copyright
©2008 The WJG Press and Baishideng.
World J Gastroenterol. Aug 21, 2008; 14(31): 4928-4937
Published online Aug 21, 2008. doi: 10.3748/wjg.14.4928
Published online Aug 21, 2008. doi: 10.3748/wjg.14.4928
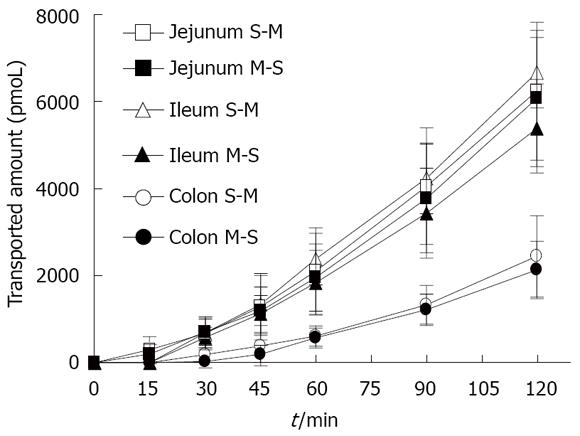
Figure 1 Time course of M-S and S-M transport of rebamipide across the different intestinal tissues.
Each value represents mean ± SE (n = 10).
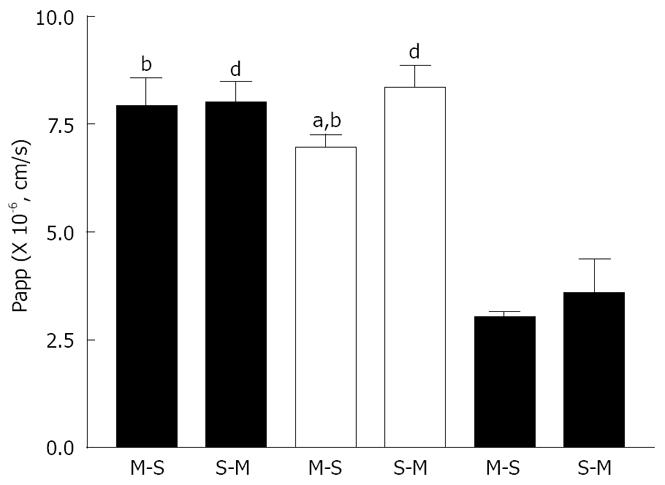
Figure 2 The Papps of rebamipide across the different intestinal regions.
Each value represents mean ± SE (n = 10). bP < 0.01 vs colon M-S, dP < 0.01 vs colon S-M, aP < 0.05 vs ileum S-M.
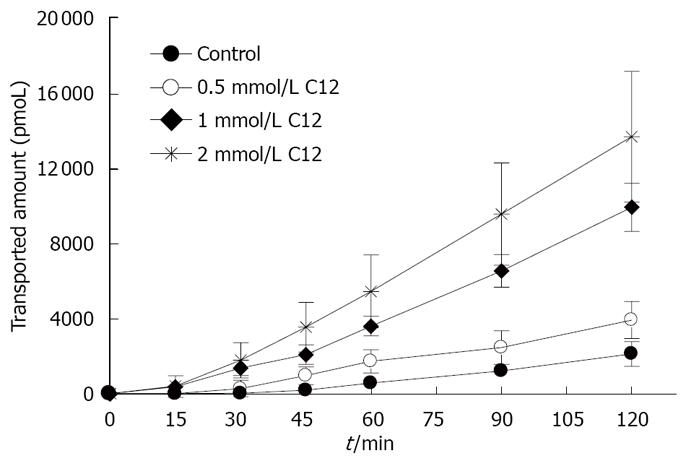
Figure 3 Time course of transport of rebamipide across the colonic tissues in the presence of various concentrations of C12.
Each value represents mean ± SE (n = 10).
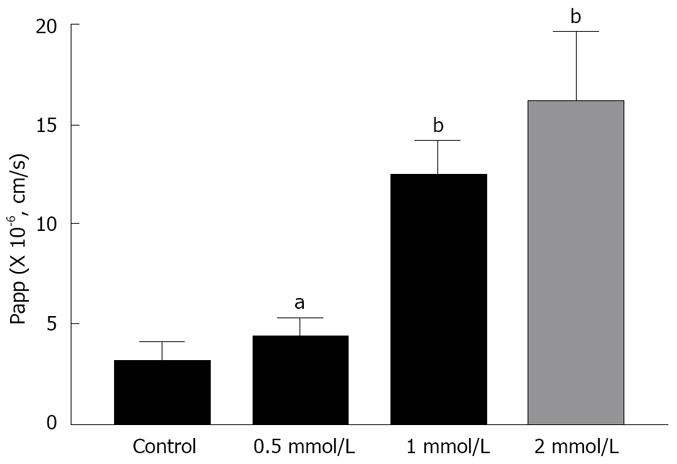
Figure 4 Effect of verious concentrations of C12 on the Papps of rebamipide in the colonic tissues.
Each value represents mean ± SE (n = 10). aP < 0.05, bP < 0.01 vs control.
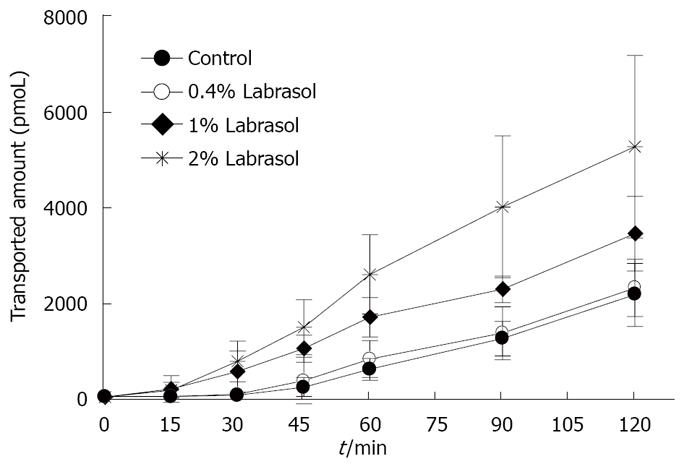
Figure 5 Time course of transport of rebamipide across the colonic tissues in the presence of various concentrations of labrasol.
Each value represents mean ± SE (n = 10).
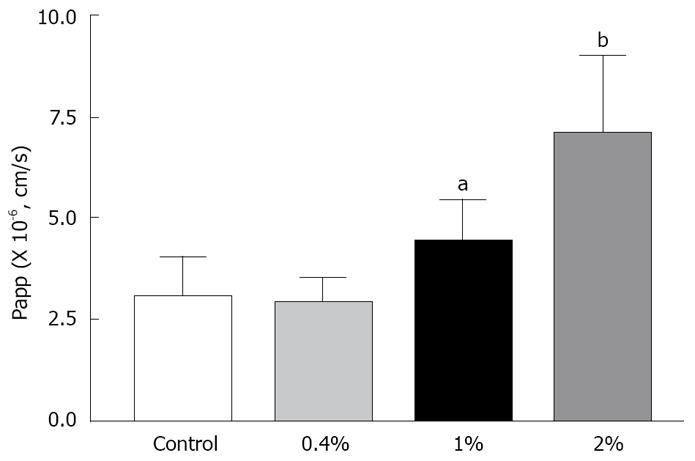
Figure 6 Effect of various concentrations of labrasol on the Papps of rebamipide in the colonic tissues.
Each value represents mean ± SE (n = 10). aP < 0.05, bP < 0.01 vs control.
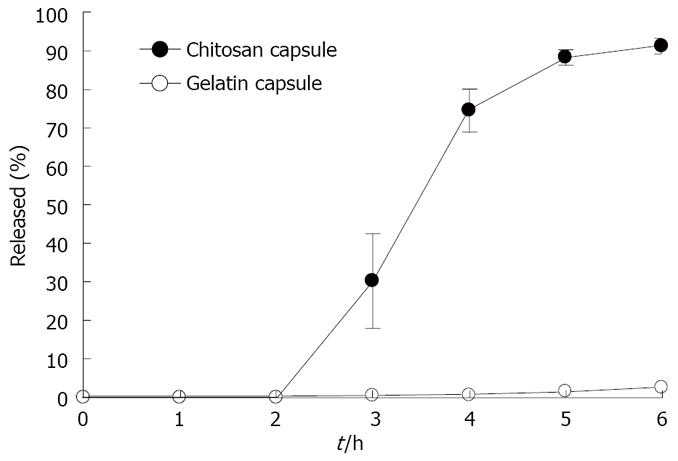
Figure 7 Release of rebamipide from chitosan capsules or gelatin capsules by Japanese pharmacopoeia rotating basket method (n = 6).
0-2 h: In the artificial gastric juice; 2-6 h: In the artificial small intestinal juice.
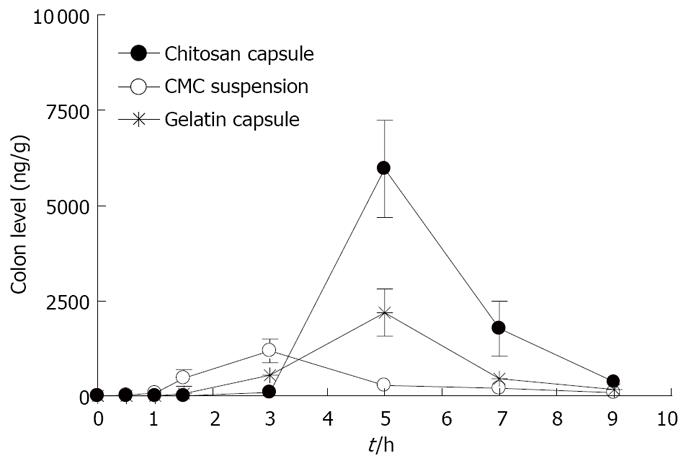
Figure 8 Concentration-time profiles of rebamipide in the colon tissue after oral administration to rat with various dosage forms.
Each value represents mean ± SE (n = 3).
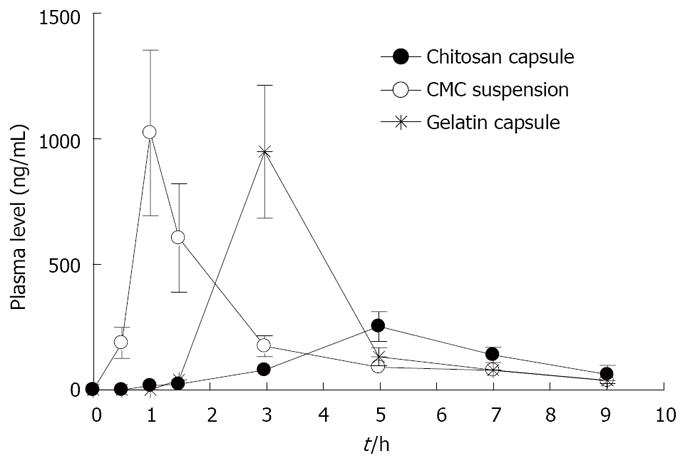
Figure 9 Plasma concentration-time profiles of rebamipide after oral administration to rat with various dosage forms.
Each value represents mean ± SE (n = 3).
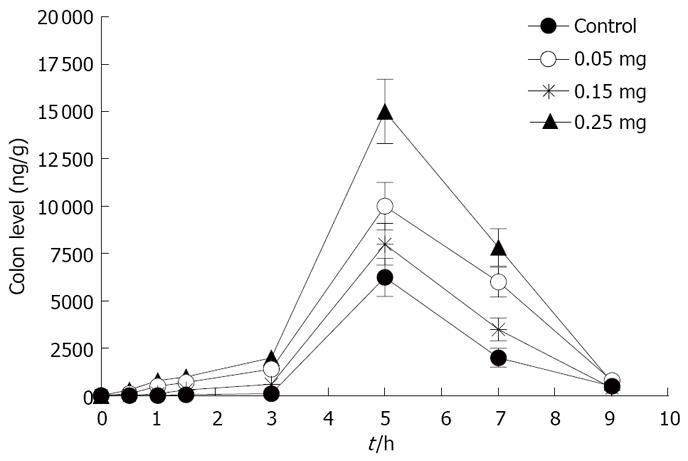
Figure 10 Concentration-time profiles of rebamipide in the colon tissue after oral administration to rat with or without C12.
Each value represents mean ± SE (n = 3).
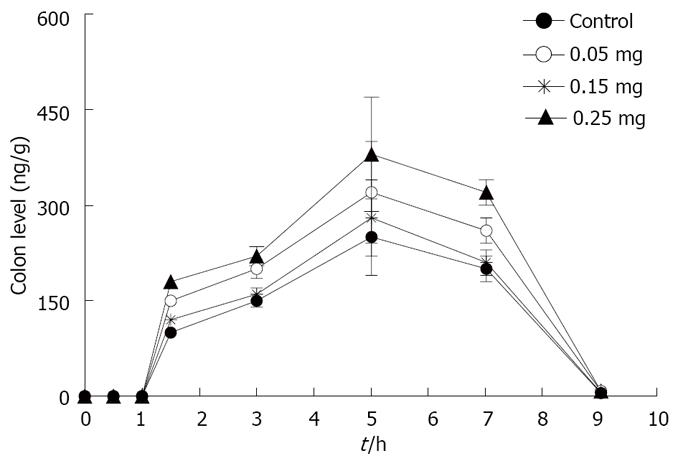
Figure 11 Plasma concentration-time profiles of rebamipide after oral administration to rat with or without C12.
Each value represents mean ± SE (n = 3).
-
Citation: Huang BB, Li GF, Luo JH, Duan L, Nobuaki K, Akira Y. Permeabilities of rebamipide
via rat intestinal membranes and its colon specific delivery using chitosan capsule as a carrier. World J Gastroenterol 2008; 14(31): 4928-4937 - URL: https://www.wjgnet.com/1007-9327/full/v14/i31/4928.htm
- DOI: https://dx.doi.org/10.3748/wjg.14.4928


