Copyright
©2008 The WJG Press and Baishideng.
World J Gastroenterol. Apr 21, 2008; 14(15): 2425-2429
Published online Apr 21, 2008. doi: 10.3748/wjg.14.2425
Published online Apr 21, 2008. doi: 10.3748/wjg.14.2425
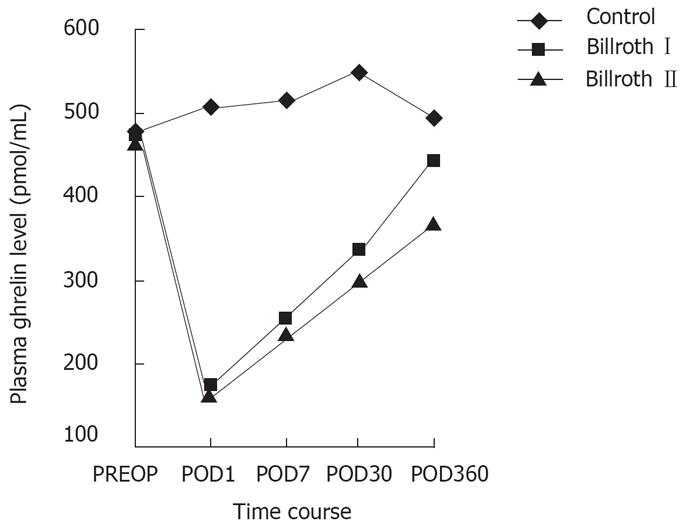
Figure 1 Alterations of ghrelin level during 360 d after operation of the two study groups and the control group.
POD: Postoperative day.
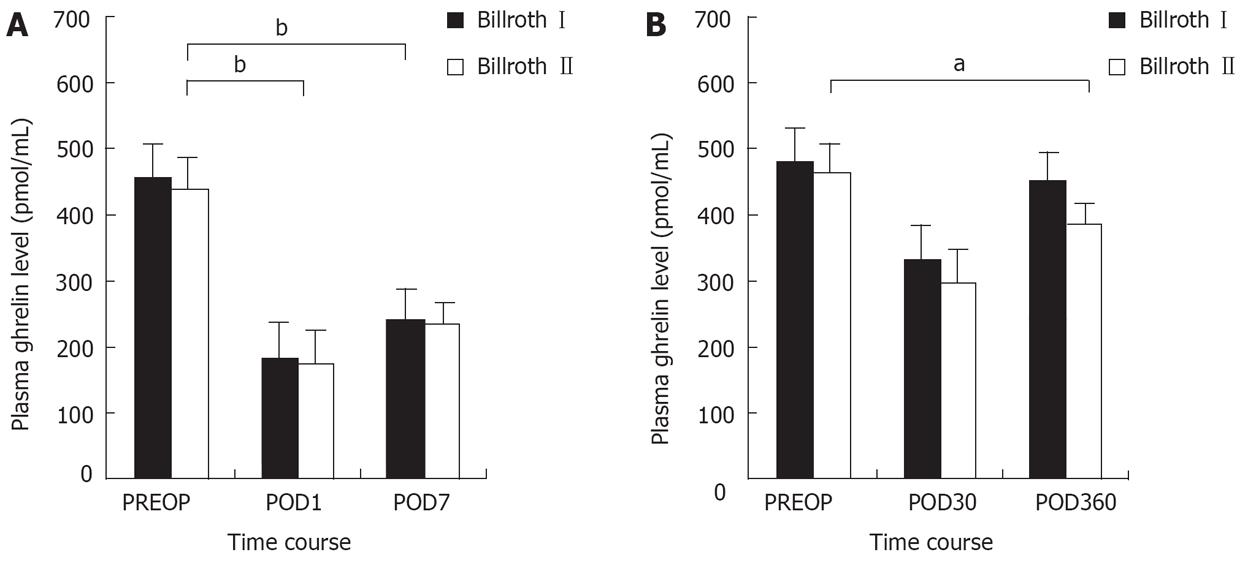
Figure 2 Alterations of ghrelin levels of two study groups at the early (A) and later (B) stage.
aP < 0.05, bP < 0.01.
Figure 3 Linear regression correlations.
(A) Detected between decrease in ghrelin level and BMI in Billroth I group patients 1 yr after operation. (B) Detected between decrease in ghrelin level and BMI in Billroth II group patients 1 yr after operation. R12 = 0.297, P < 0.007. R22 = 0.559, P < 0.001.
- Citation: Wang HT, Lu QC, Wang Q, Wang RC, Zhang Y, Chen HL, Zhao H, Qian HX. Role of the duodenum in regulation of plasma ghrelin levels and body mass index after subtotal gastrectomy. World J Gastroenterol 2008; 14(15): 2425-2429
- URL: https://www.wjgnet.com/1007-9327/full/v14/i15/2425.htm
- DOI: https://dx.doi.org/10.3748/wjg.14.2425


