Copyright
©2008 The WJG Press and Baishideng.
World J Gastroenterol. Apr 21, 2008; 14(15): 2377-2382
Published online Apr 21, 2008. doi: 10.3748/wjg.14.2377
Published online Apr 21, 2008. doi: 10.3748/wjg.14.2377
Figure 1 CD20 immunostaining for distribution of B lymphocytes.
There was no significant difference in distribution of B lymphocytes between PH and control groups; they were all mainly located in the splenic corpuscle. A: Control group; B: PH group (× 100).
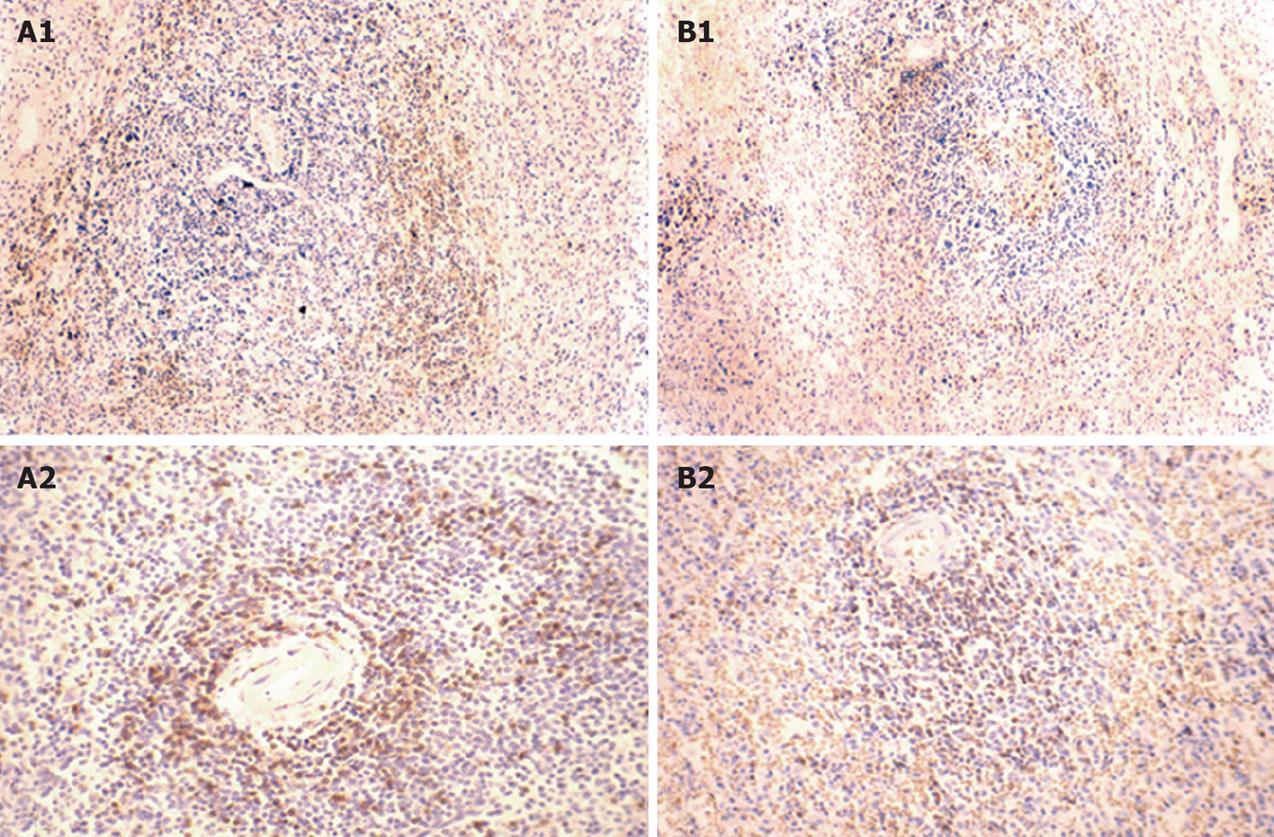
Figure 2 CD3 immunostaining for distribution of T lymphocytes.
There was no significant difference in distribution of T lymphocytes between PH and control groups; they were all mainly located in the marginal zone and PALS. A1: Control group, marginal zone; A2: Control group, PALS; B1: PH group, marginal zone; B2: PH group, PALS (× 100).
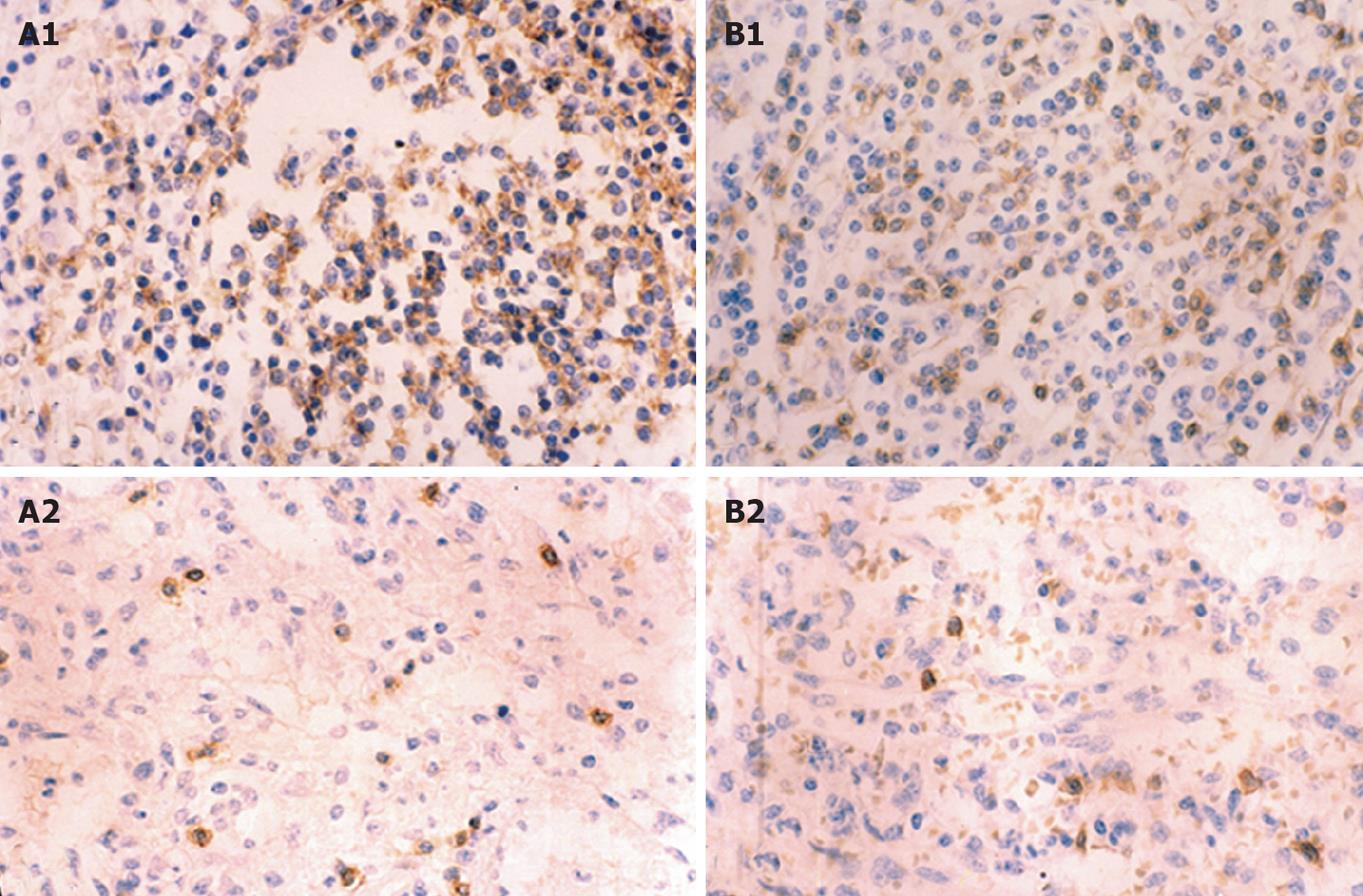
Figure 3 CD20 immunostaining for density of B lymphocytes.
Compared to the control group, the density of B lymphocytes in the PH group decreased significantly in the splenic corpuscle and RP. A1: Control group, splenic corpuscle; A2: Control group, RP; B1: PH group, splenic corpuscle; B2: PH group, RP (× 100).
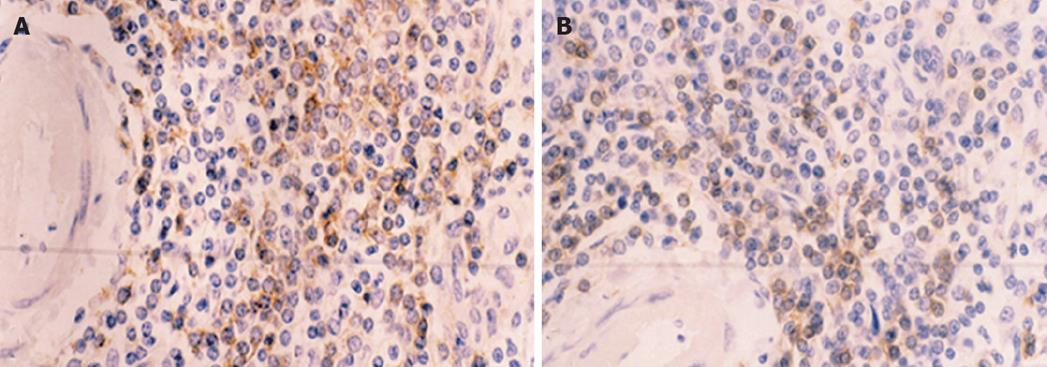
Figure 4 CD3 immunostaining for density of B lymphocytes.
Compare to the control group, the density of T lymphocytes in the PH group decreased significantly in PALS. A: Control group; B: PH group (× 100).
- Citation: Li ZF, Zhang S, Lv GB, Huang Y, Zhang W, Ren S, Yang J, Dang SS. Changes in count and function of splenic lymphocytes from patients with portal hypertension. World J Gastroenterol 2008; 14(15): 2377-2382
- URL: https://www.wjgnet.com/1007-9327/full/v14/i15/2377.htm
- DOI: https://dx.doi.org/10.3748/wjg.14.2377


