Copyright
©2007 Baishideng Publishing Group Inc.
World J Gastroenterol. Nov 21, 2007; 13(43): 5707-5717
Published online Nov 21, 2007. doi: 10.3748/wjg.v13.i43.5707
Published online Nov 21, 2007. doi: 10.3748/wjg.v13.i43.5707
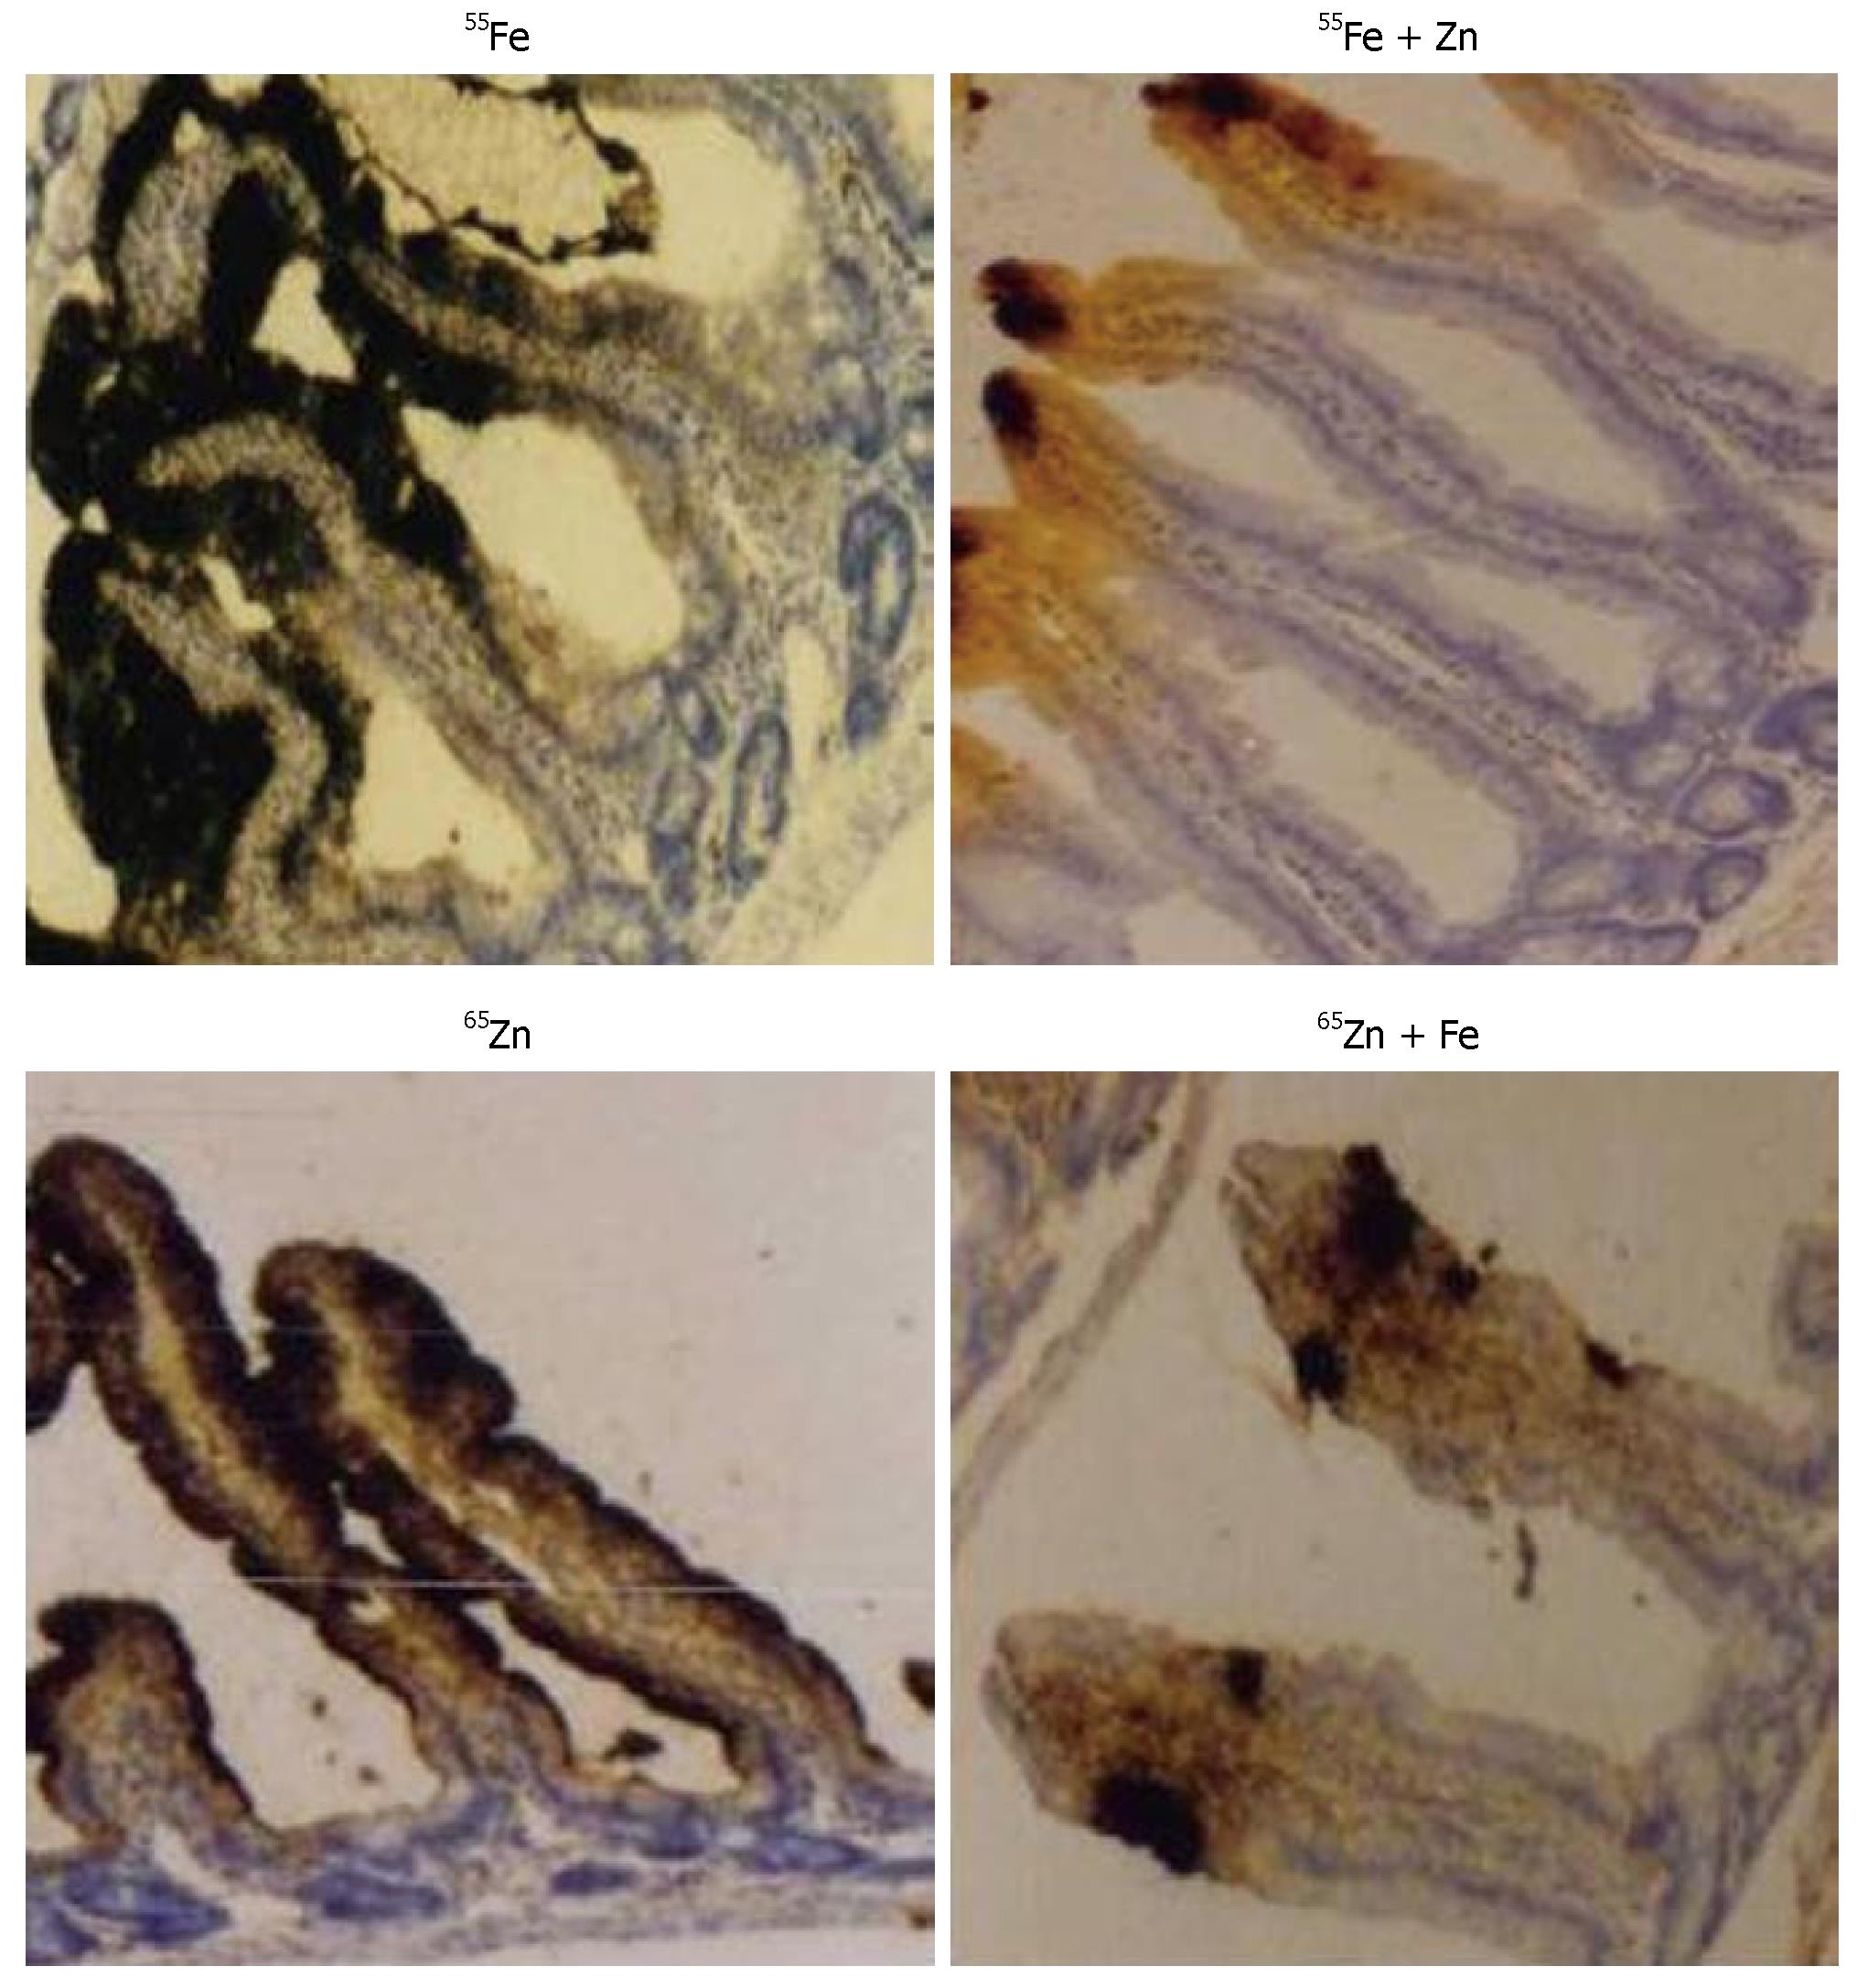
Figure 1 Zn reduces uptake of 55Fe and Fe reduces uptake of 65Zn during combined administration: A representative microautoradiogram of the duodenal mucosa of 55Fe in Fe (top left), Fe + Zn (top right), 65Zn in Zn (bottom left) and Fe + Zn (bottom right) groups.
Iron and zinc deficient rats were orally administered 37mBq of 55Fe and 4.0 mg Fe and/or 37mBq of 65Zn and 3.3 mg Zn. Presence of black spots in the intestinal mucosa indicates the presence of the radioactivity (× 100).
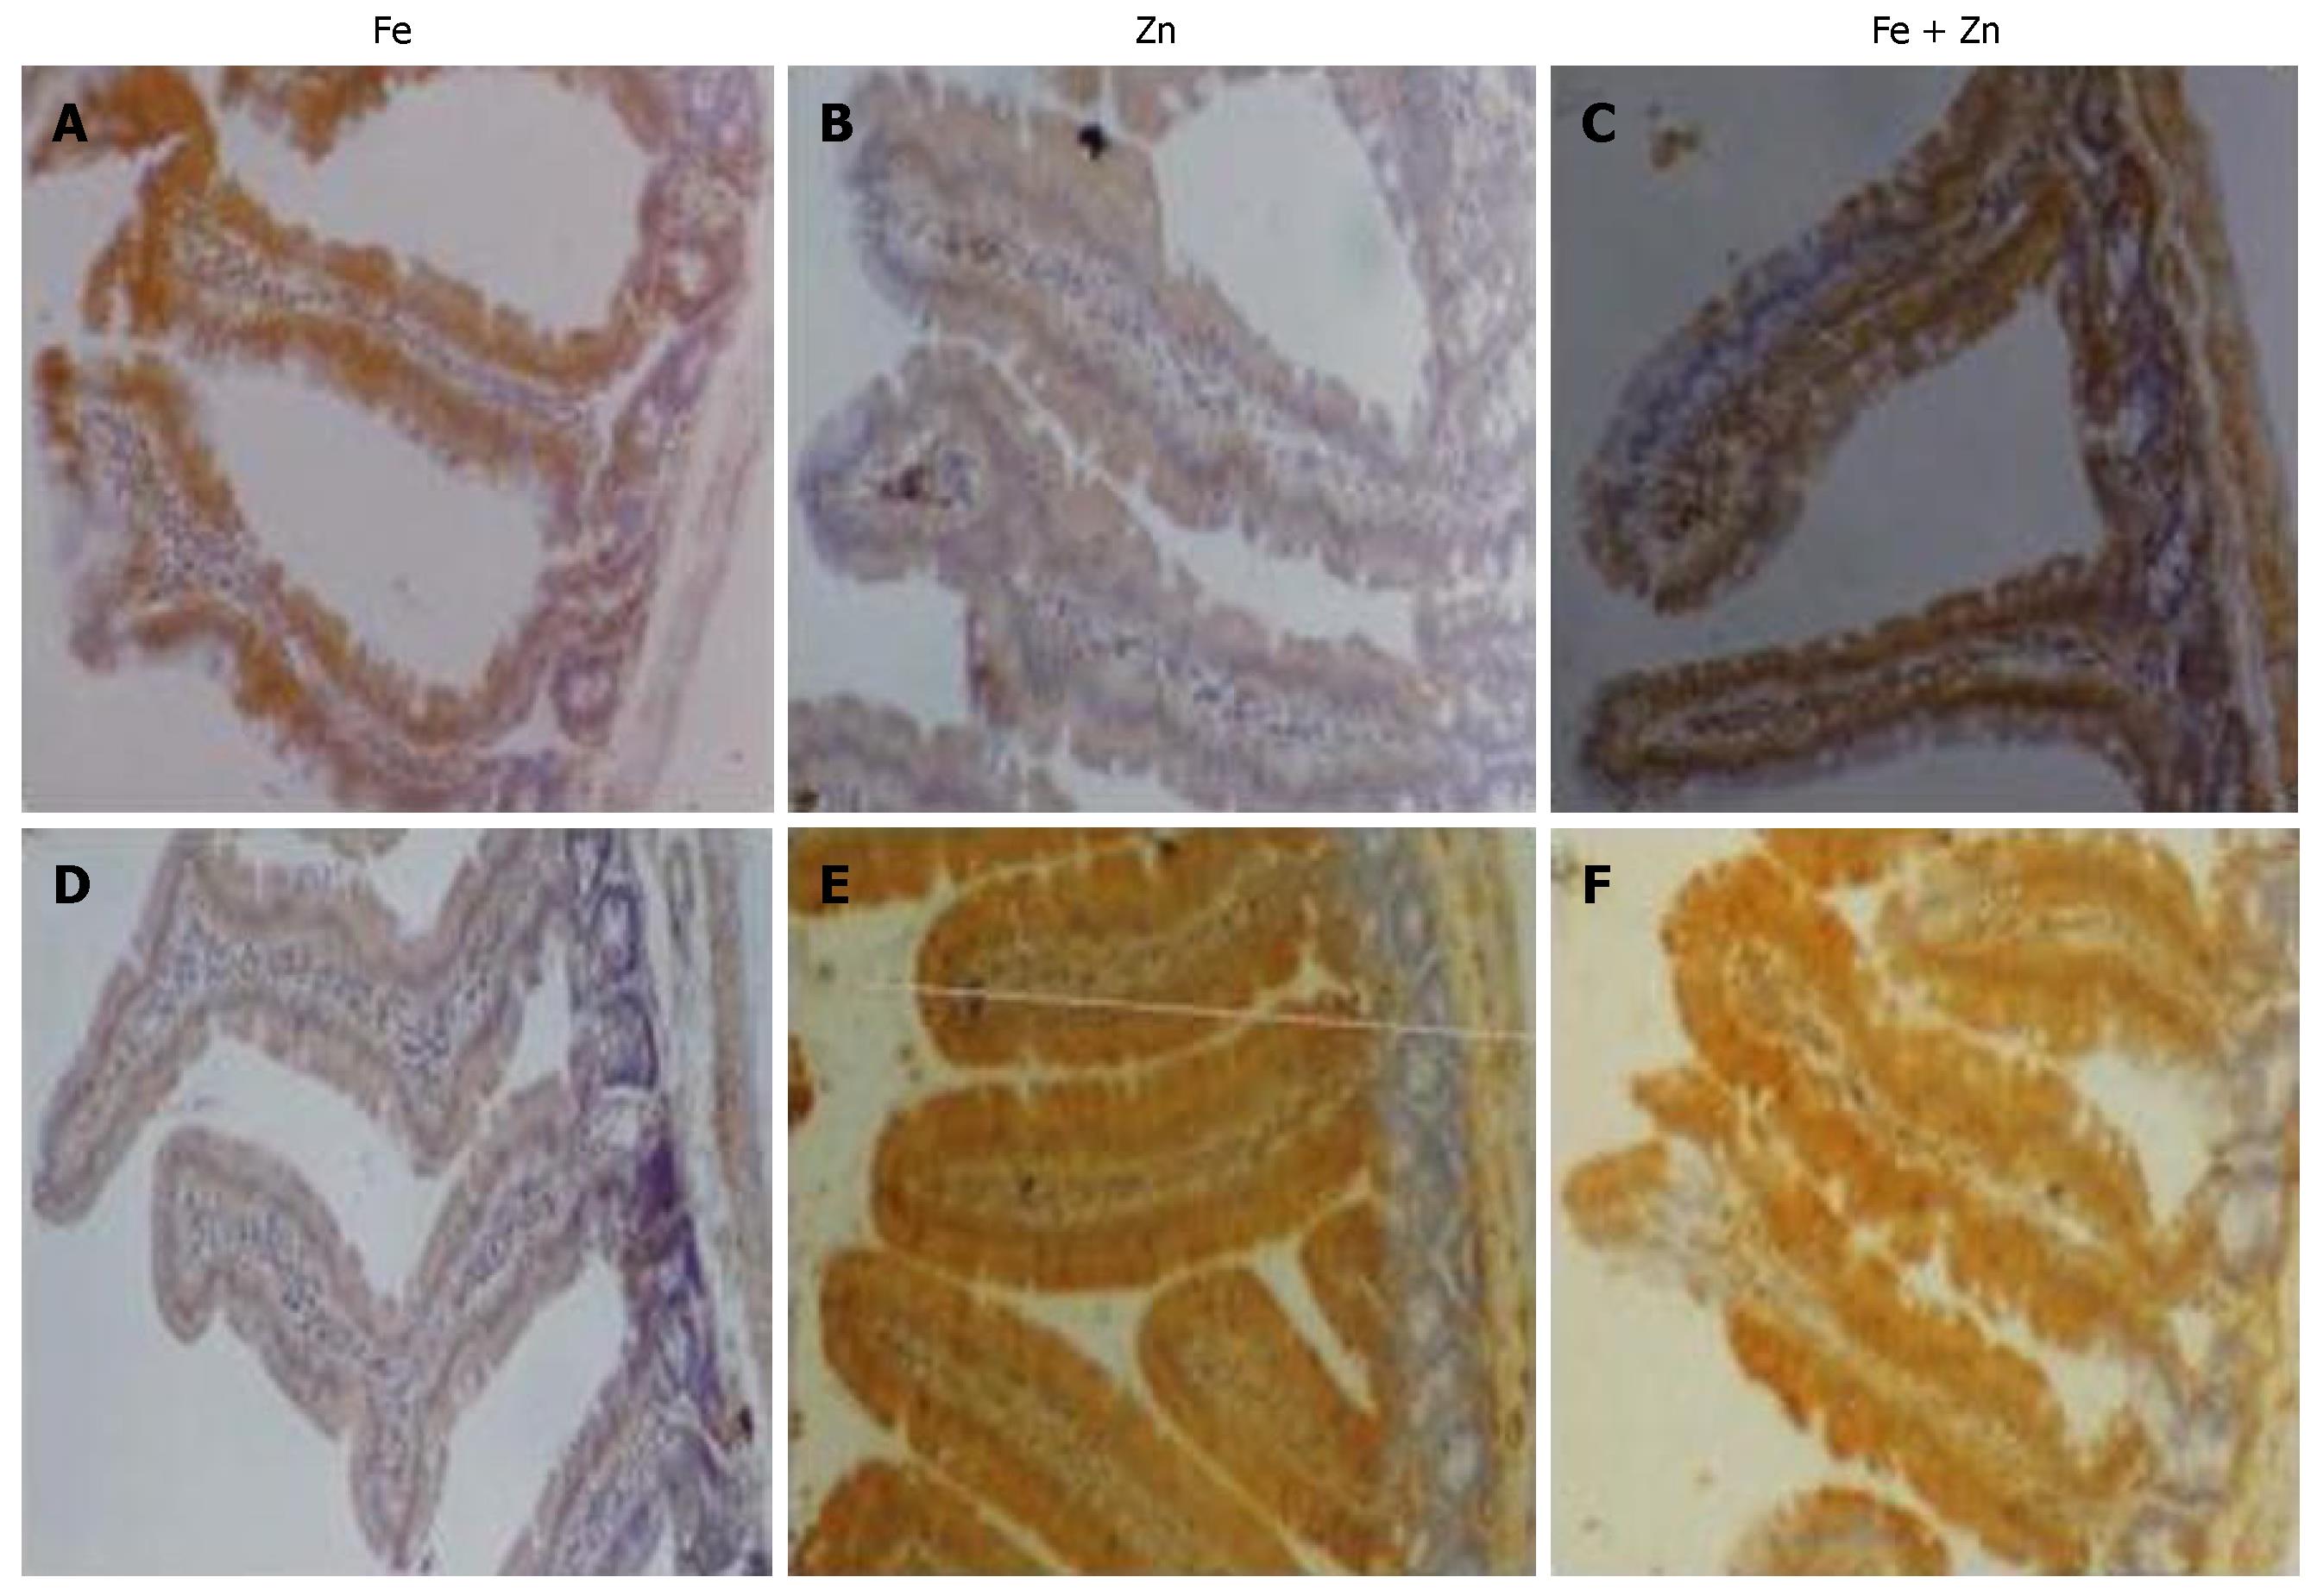
Figure 2 Zn reduces ferritin but enhances metallothionein abundance in the intestinal mucosa: A representative photomicrograph of the immunohistochemical localization of ferritin (top panel) and metallothionein (bottom panel) in the intestinal mucosa of Fe, Zn and Fe + Zn repleted groups.
The staining intensity indicates the abundance of ferritin and metallothionein (× 250).
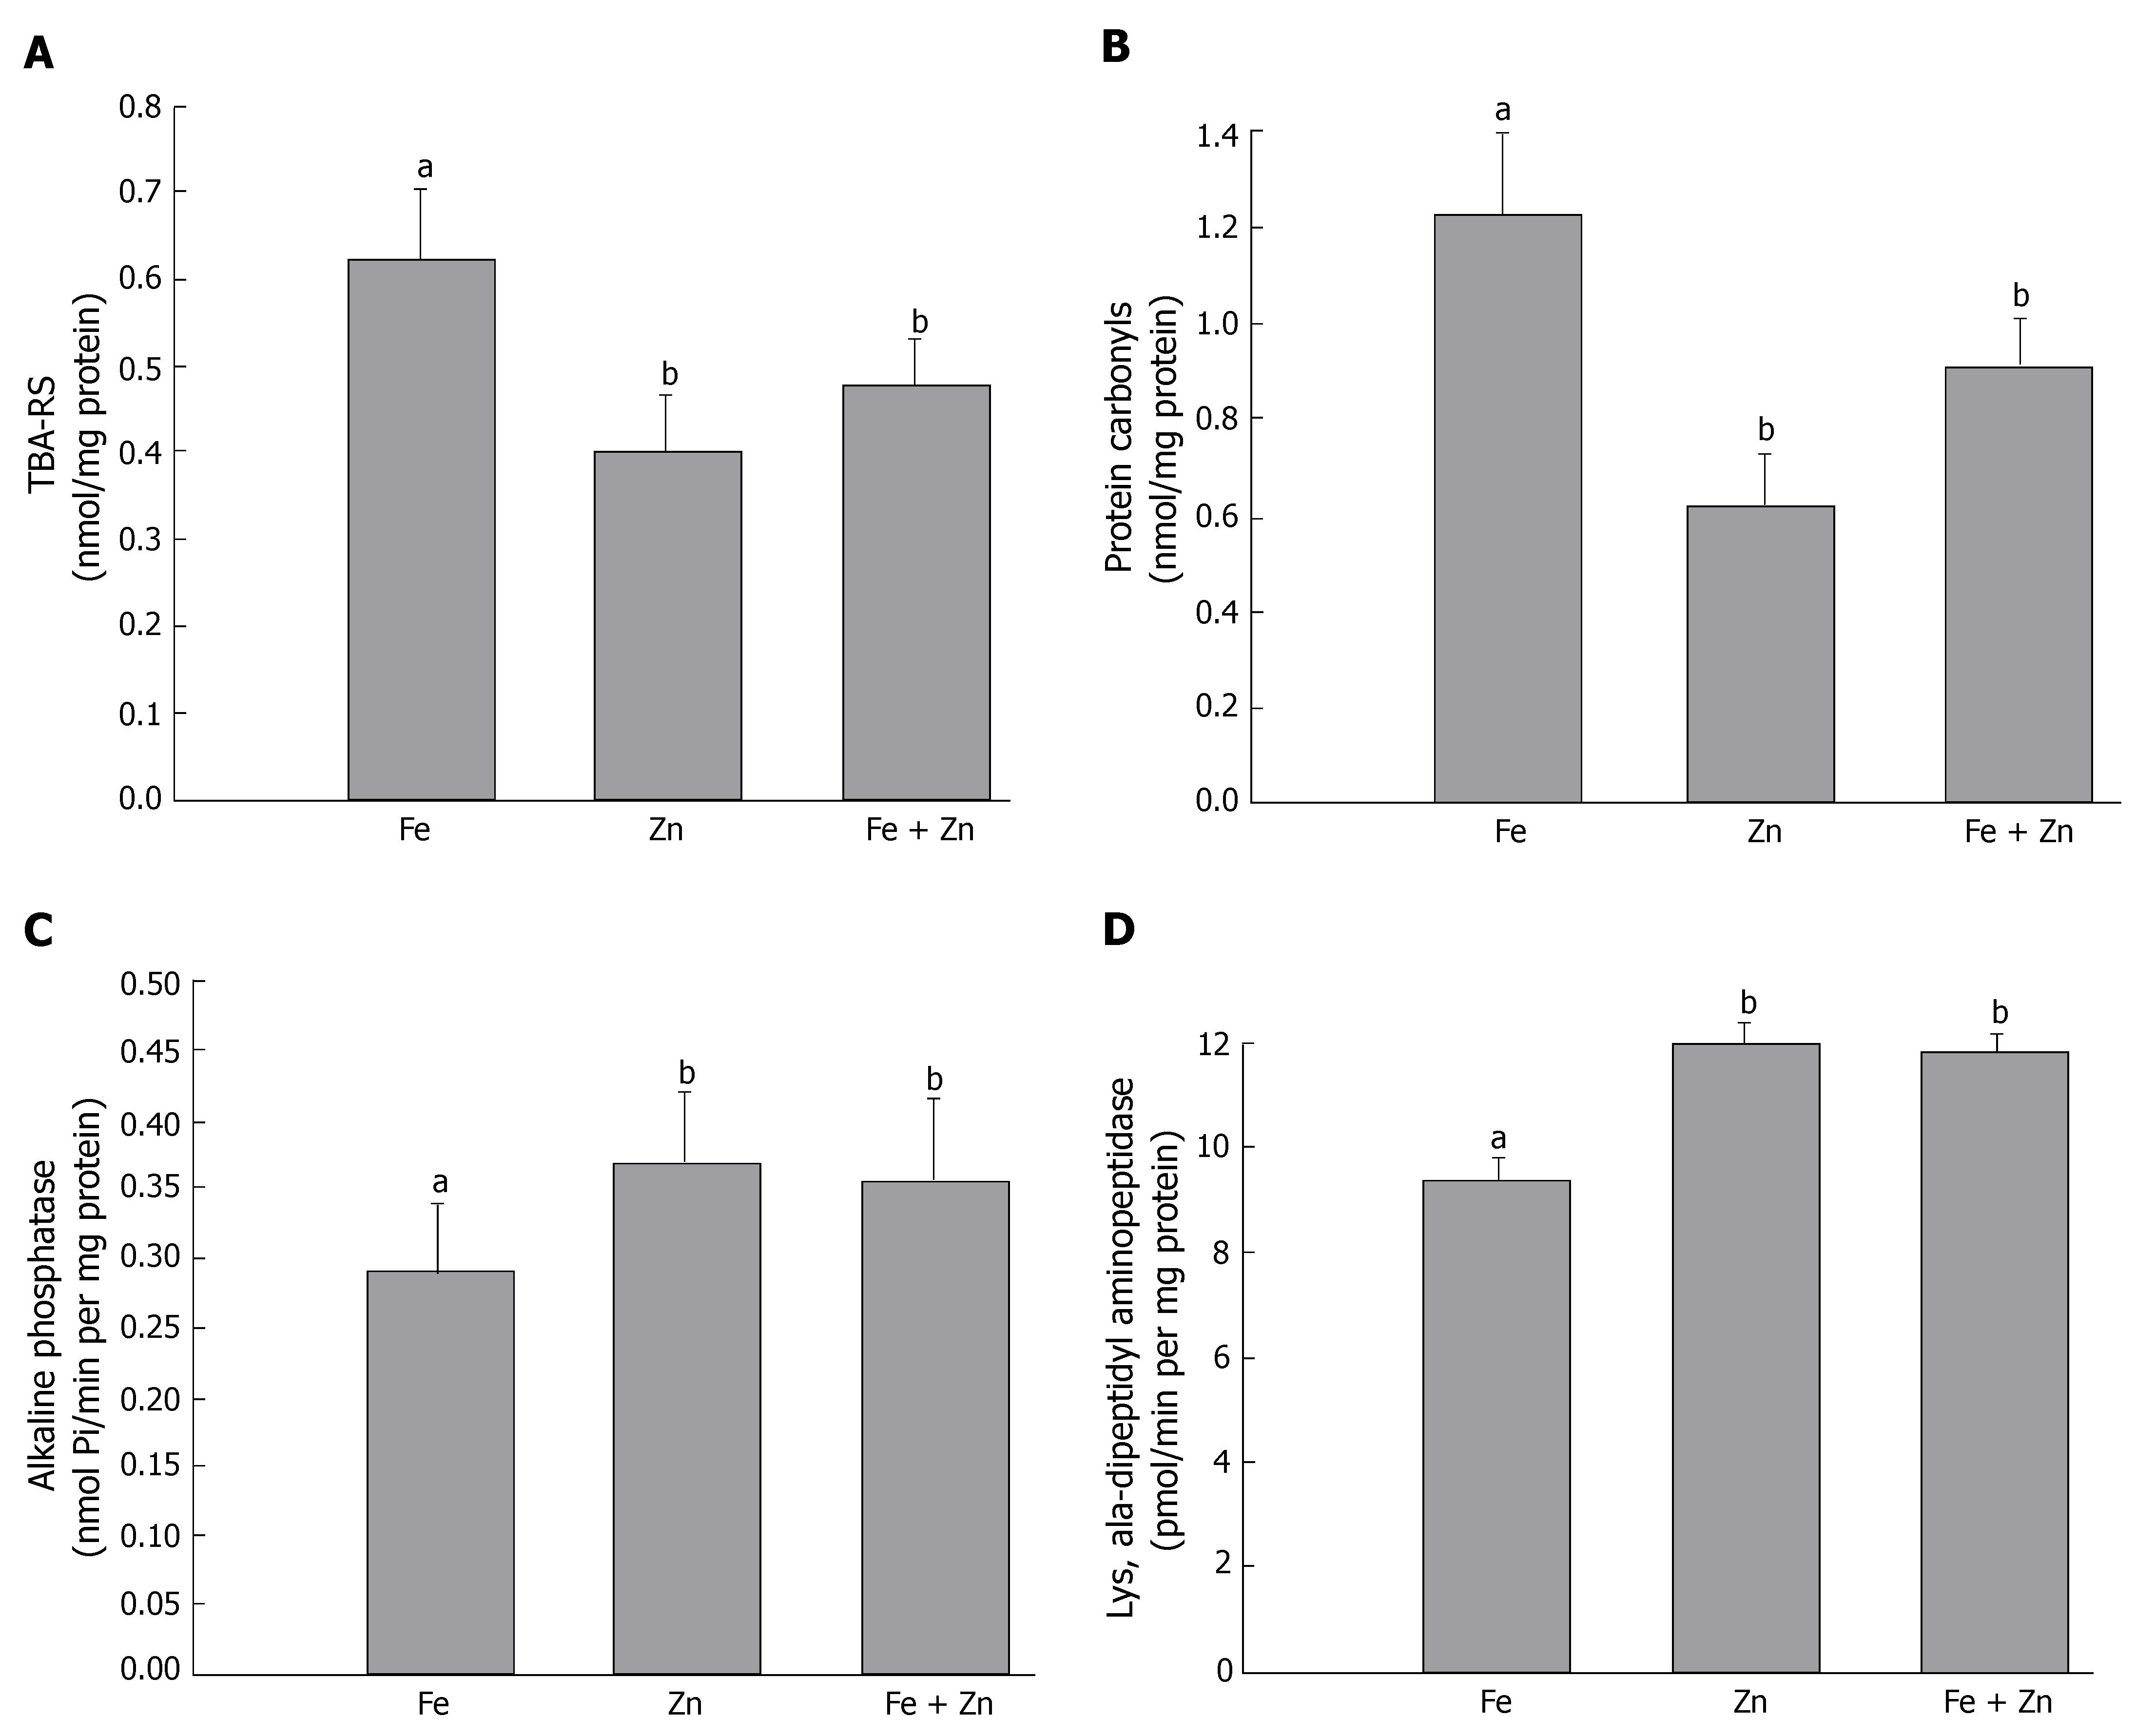
Figure 3 Iron increases intestinal oxidative stress and lowers functional integrity: Concentrations of thiobarbituric acid-reactive substances (TBA-RS) and protein carbonyls (A and B) as indicators of oxidative stress, and activities of alkaline phosphatase and lys-ala-dipeptidyl aminopeptidase (C and D), as markers of mucosal functional integrity, in the intestinal mucosa of iron and zinc deficient rats treated with iron and/or zinc.
Fe: Iron administered group; Zn: Zinc administered group; Fe + Zn: Iron and zinc administered group; Number of animals: 7 in each group. Vertical columns and error bars represent mean and SD respectively; Bars with different superscripts are significantly different with P < 0.05 among groups.
Figure 4 Changes in antioxidant enzyme activities due to iron and zinc repletion: Activity levels of superoxide dismutase (SOD, A and B), catalase (C) and glutathione peroxidase (Gpx, D) in the small intestinal mucosa of rats during repletion with iron and/or zinc.
Total SOD activity indicates the activity of Cu, Zn-SOD and Mn-SOD. Fe: Iron administered group; Zn: Zinc administered group; Fe + Zn: Iron and zinc administered group; Number of animals: 8 in each group. Vertical columns and error bars represent mean and SD respectively; bars with different superscripts are significantly different with P < 0.05.
Figure 5 Altered intestinal mucosal redox status: Changes in the levels of GSH (Panel A) and GSSG (Panel B) in the intestinal mucosa at the end of repletion for 2 wk with iron and/or zinc.
Vertical columns and error bars represent mean and SD respectively; bars with different superscripts are significantly different with P < 0.05.
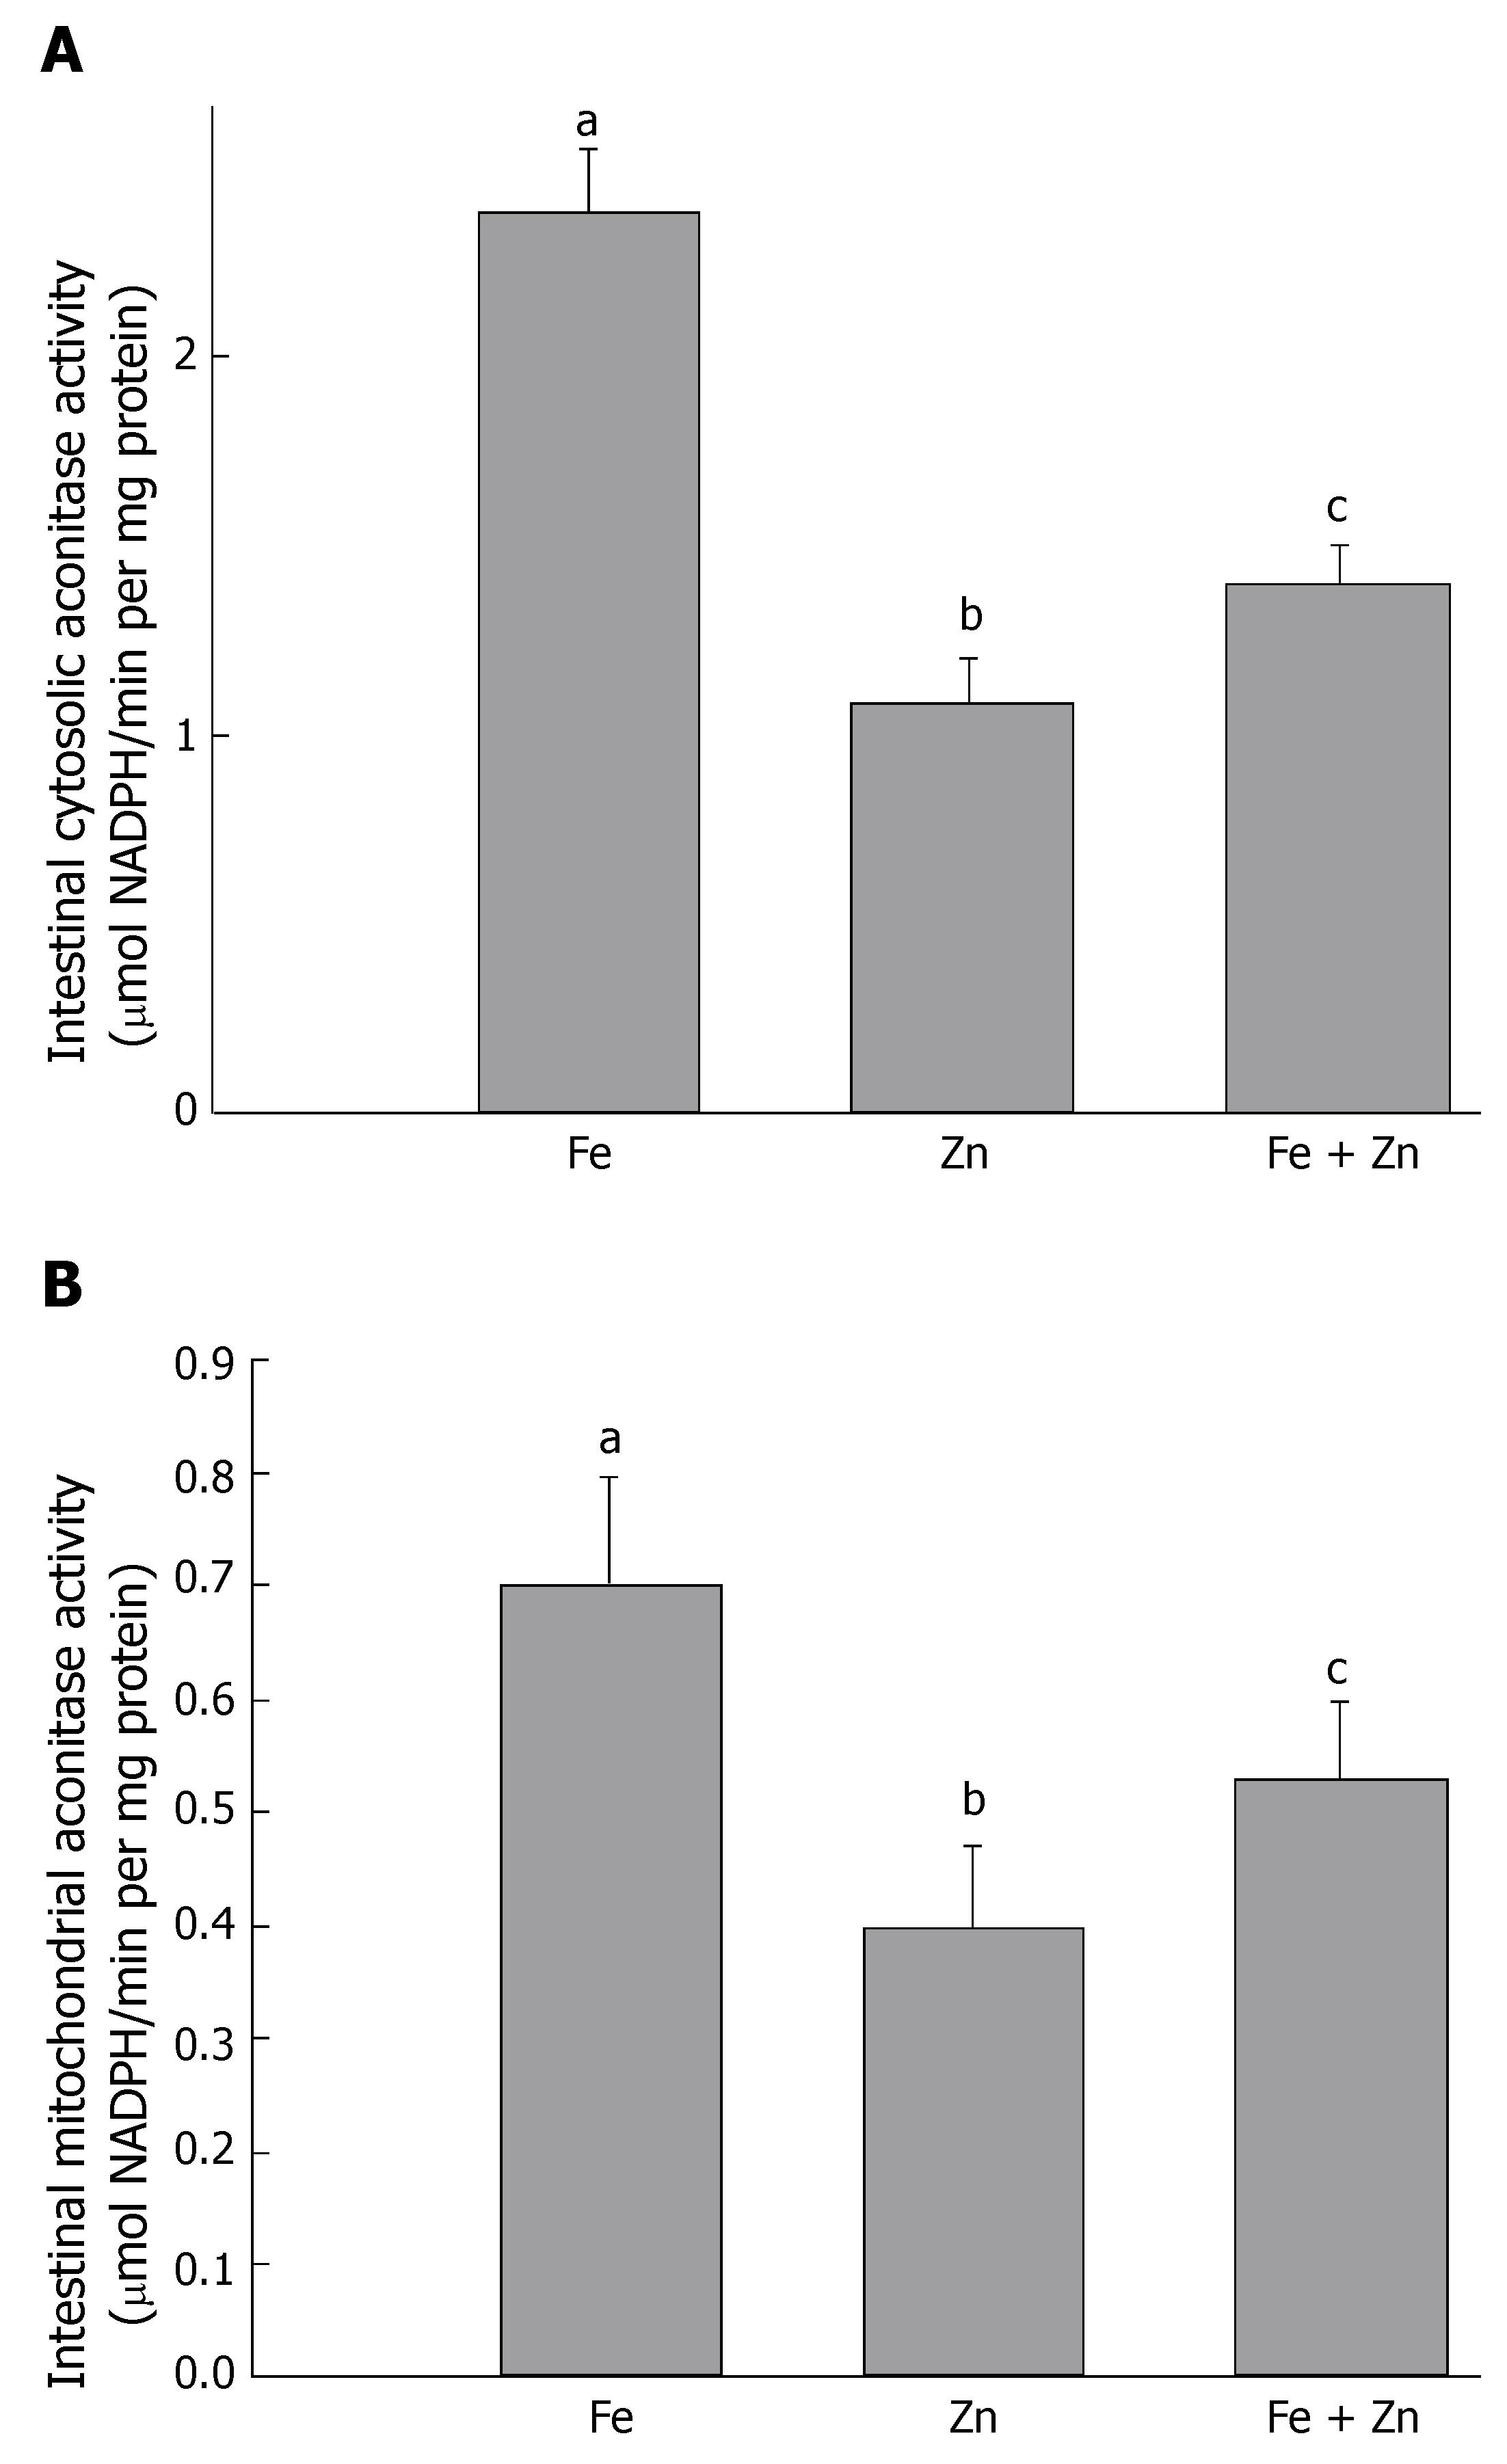
Figure 6 Intestinal aconitase activity in response to iron and/or zinc repletion: Response of intestinal cytosolic (Panel A) and mitochondrial (Panel B) aconitase to intestinal iron content and as a functional indicator of oxidative stress after 2 wk of oral iron and/or zinc administration.
Fe: Iron administered group; Zn: Zinc administered group; Fe + Zn: Iron and zinc administered group. Number of animals :is 8 in each group. Vertical columns and error bars represent mean and SD respectively; bars with different superscripts are significantly different with P < 0.05.
- Citation: Bodiga S, Krishnapillai MN. Concurrent repletion of iron and zinc reduces intestinal oxidative damage in iron- and zinc-deficient rats. World J Gastroenterol 2007; 13(43): 5707-5717
- URL: https://www.wjgnet.com/1007-9327/full/v13/i43/5707.htm
- DOI: https://dx.doi.org/10.3748/wjg.v13.i43.5707


