Copyright
©2007 Baishideng Publishing Group Inc.
World J Gastroenterol. Nov 21, 2007; 13(43): 5692-5698
Published online Nov 21, 2007. doi: 10.3748/wjg.v13.i43.5692
Published online Nov 21, 2007. doi: 10.3748/wjg.v13.i43.5692
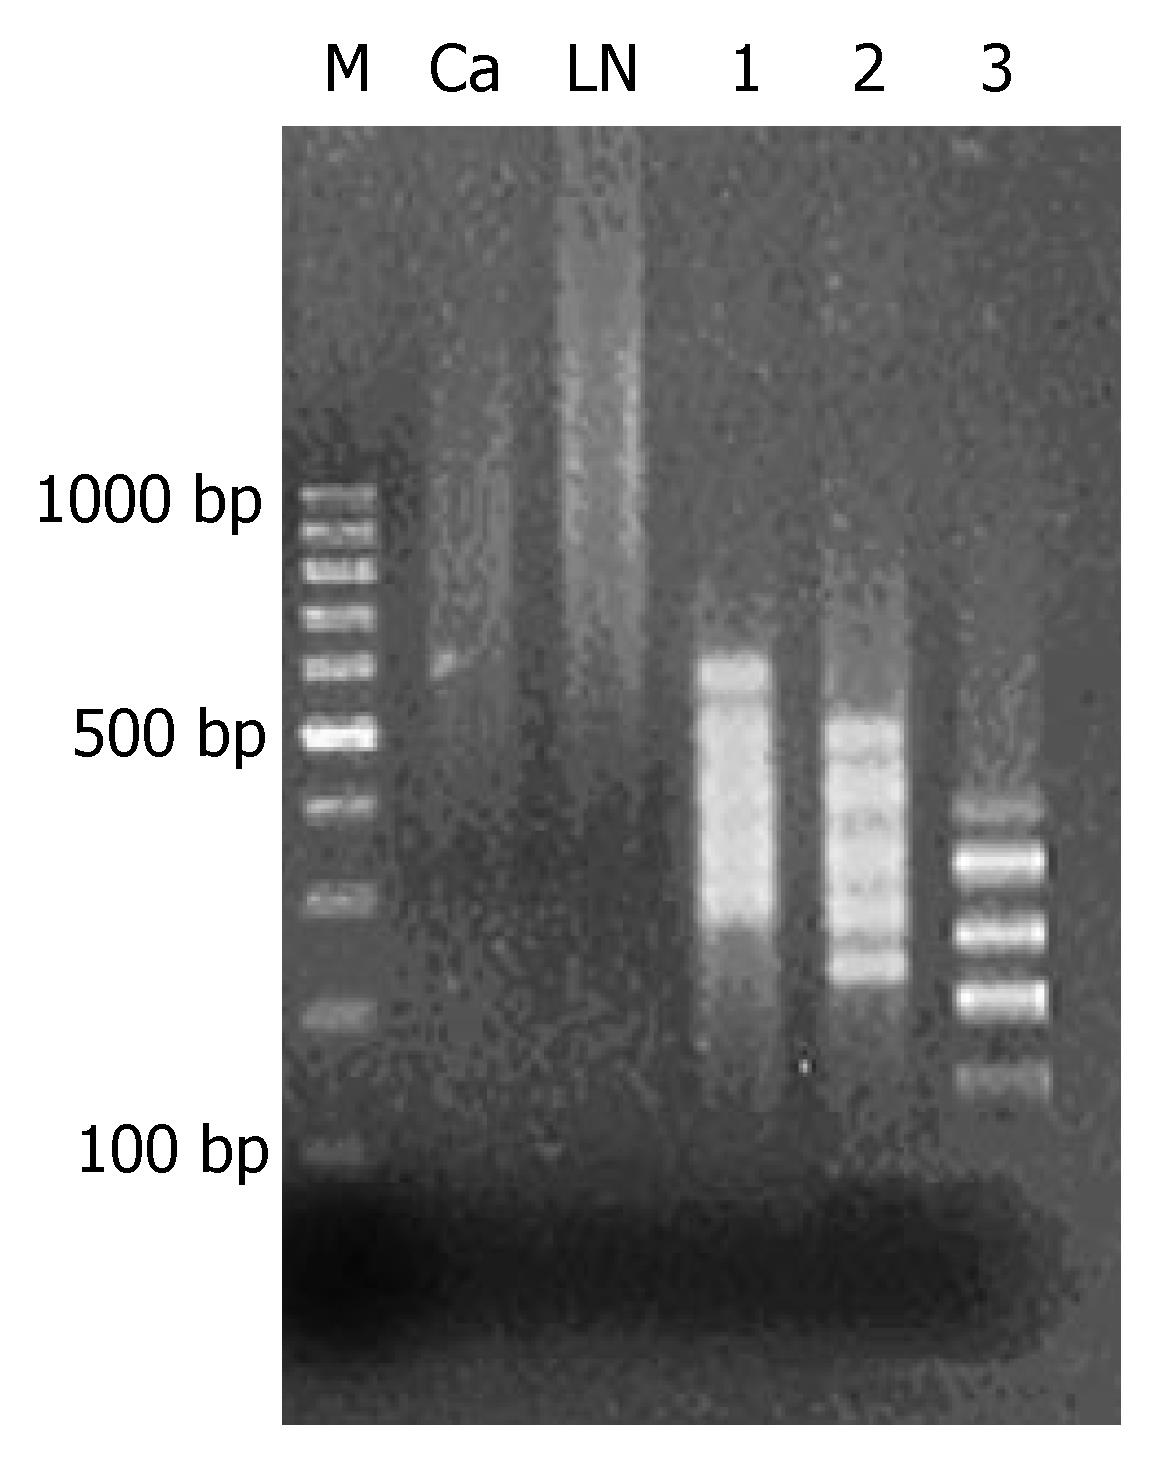
Figure 1 Methylated CpG islands amplification (MCA) and representational difference analysis (RDA).
M: Marker; Ca: MCA products of gastric cancer tissues; LN: MCA products of metastatic lymph nodes; lanes 1-3: The 1st to the 3rd round RDA products. After methylated CpG islands amplification (MCA) of genome DNA of primary tumor and metastatic lymph nodes, bright smears were observed between 300 bp and 2000 bp, which were the concentrated methylated CpG islands. From the 1st to the 3rd cycle of analysis, fragments with methylation difference decreased gradually and the straps gradually became clear. In the 3rd RDA analysis, 5 straps of different methylation were observed.
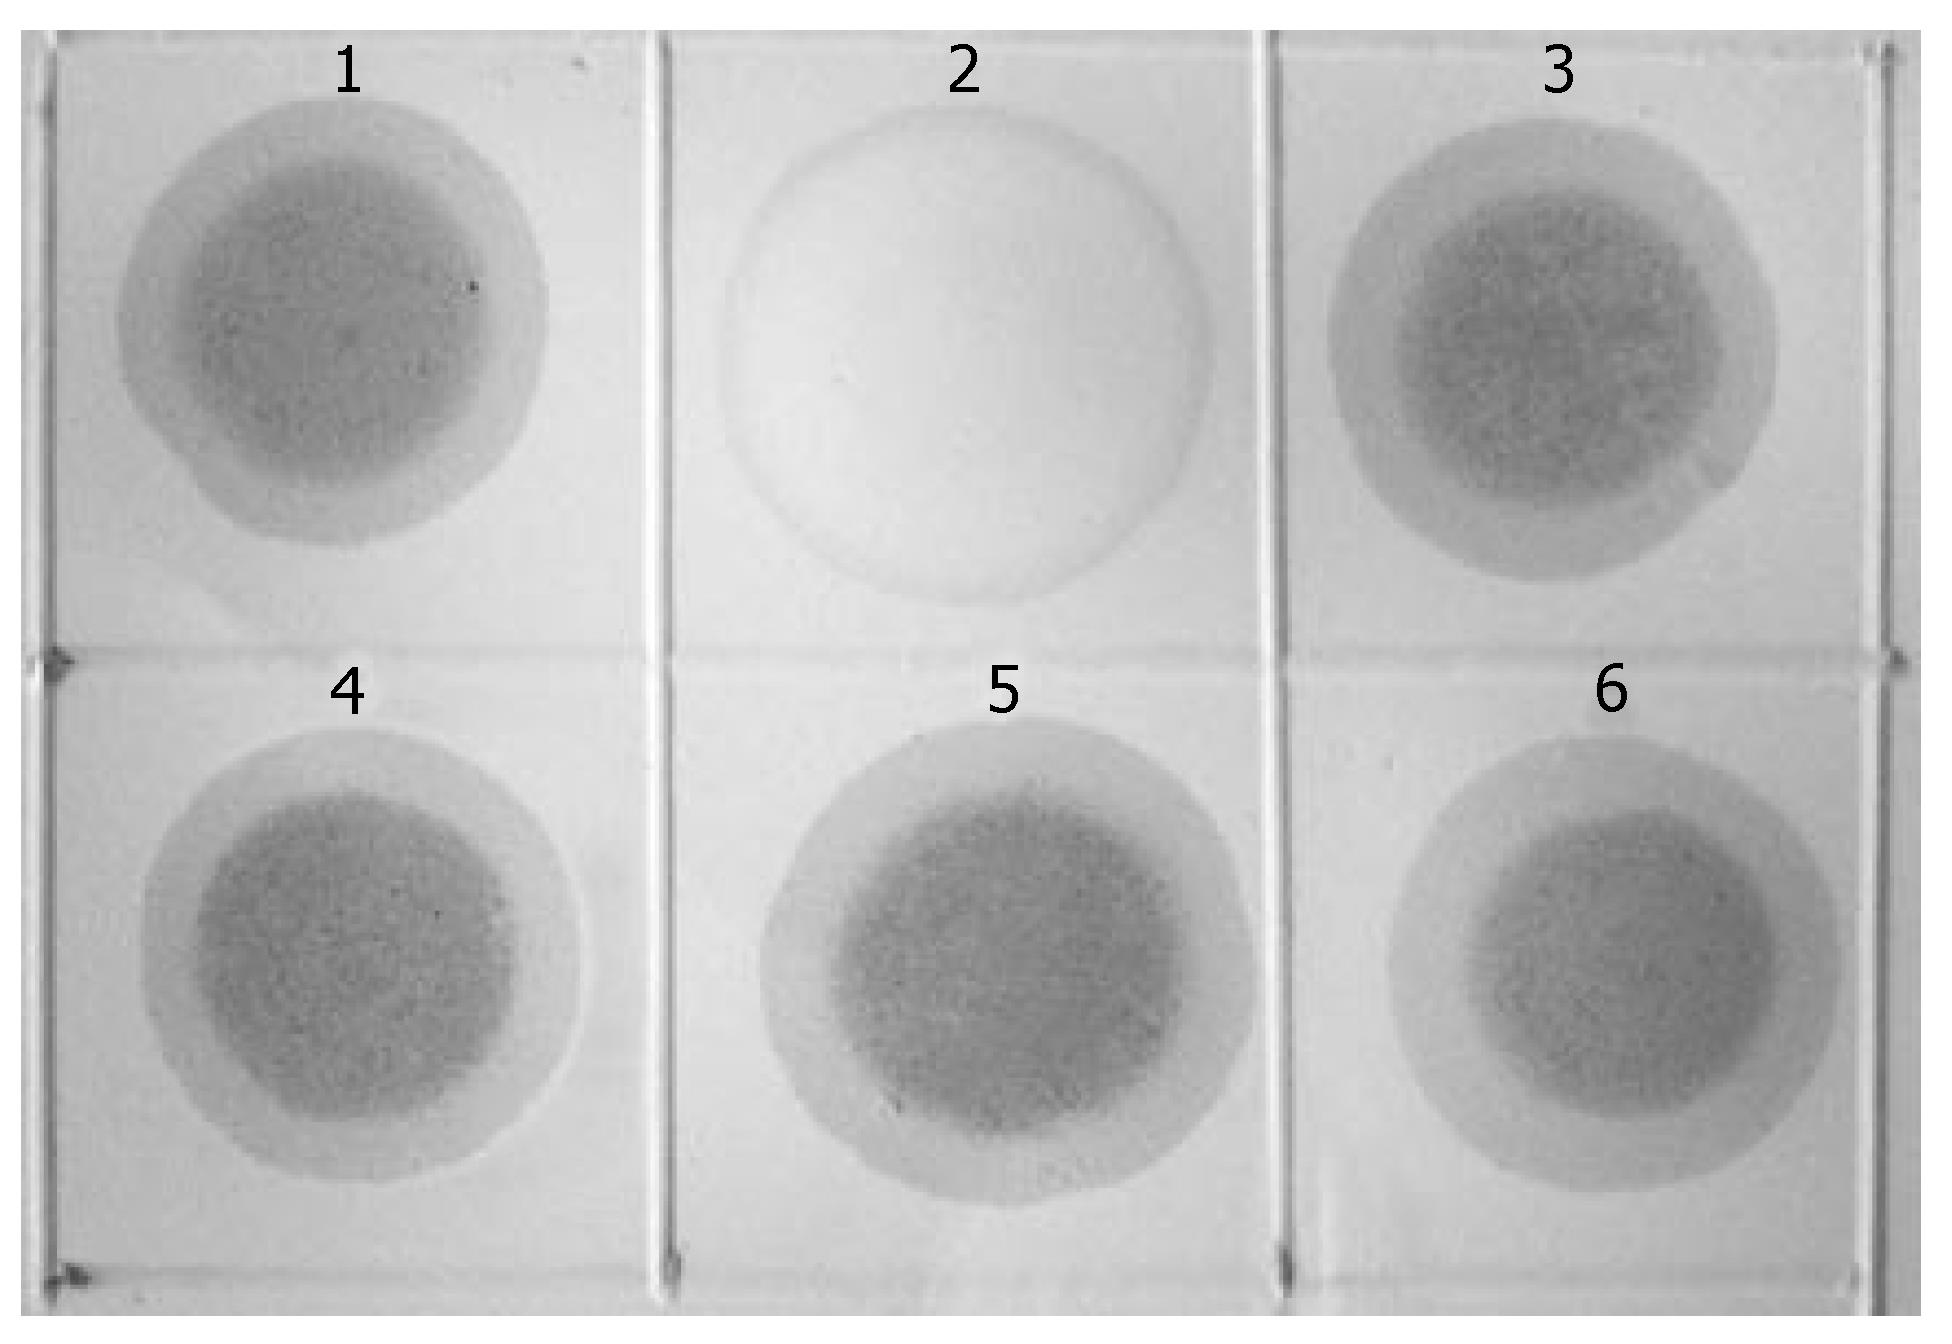
Figure 2 Dot blot analysis.
1: Positive control; 2: MCA products of gastric cancer tissues; 3: MCA products of metastatic lymph nodes; and 4-6: the first to the third round RDA products. KL122 sequence was labeled with digoxin to form the probe; with this latter the three rounds MCA-RDA products were undergone hybridization analysis with testers and drivers. Positive results were observed in all products of the three-round RDA as well as in testers, while negative one in drivers.
Figure 3 Methylation-specific PCR (MSP) of gene PTPRG.
M: Marker; u: Unmethylated (158 bp); m: Methylated (150 bp). A positive band was observed at 158 bp of non-methylation PCR of primary tumor, with a positive rate of 77.78% (28/36), while that of metastatic lymph nodes was 63.89% (23/36). A positive strap was observed at 150 bp of methylation PCR of metastatic lymph nodes, with a positive rate of 52.78% (19/36), while that of primary tumor was 25.0% (9/36) (P < 0.05).
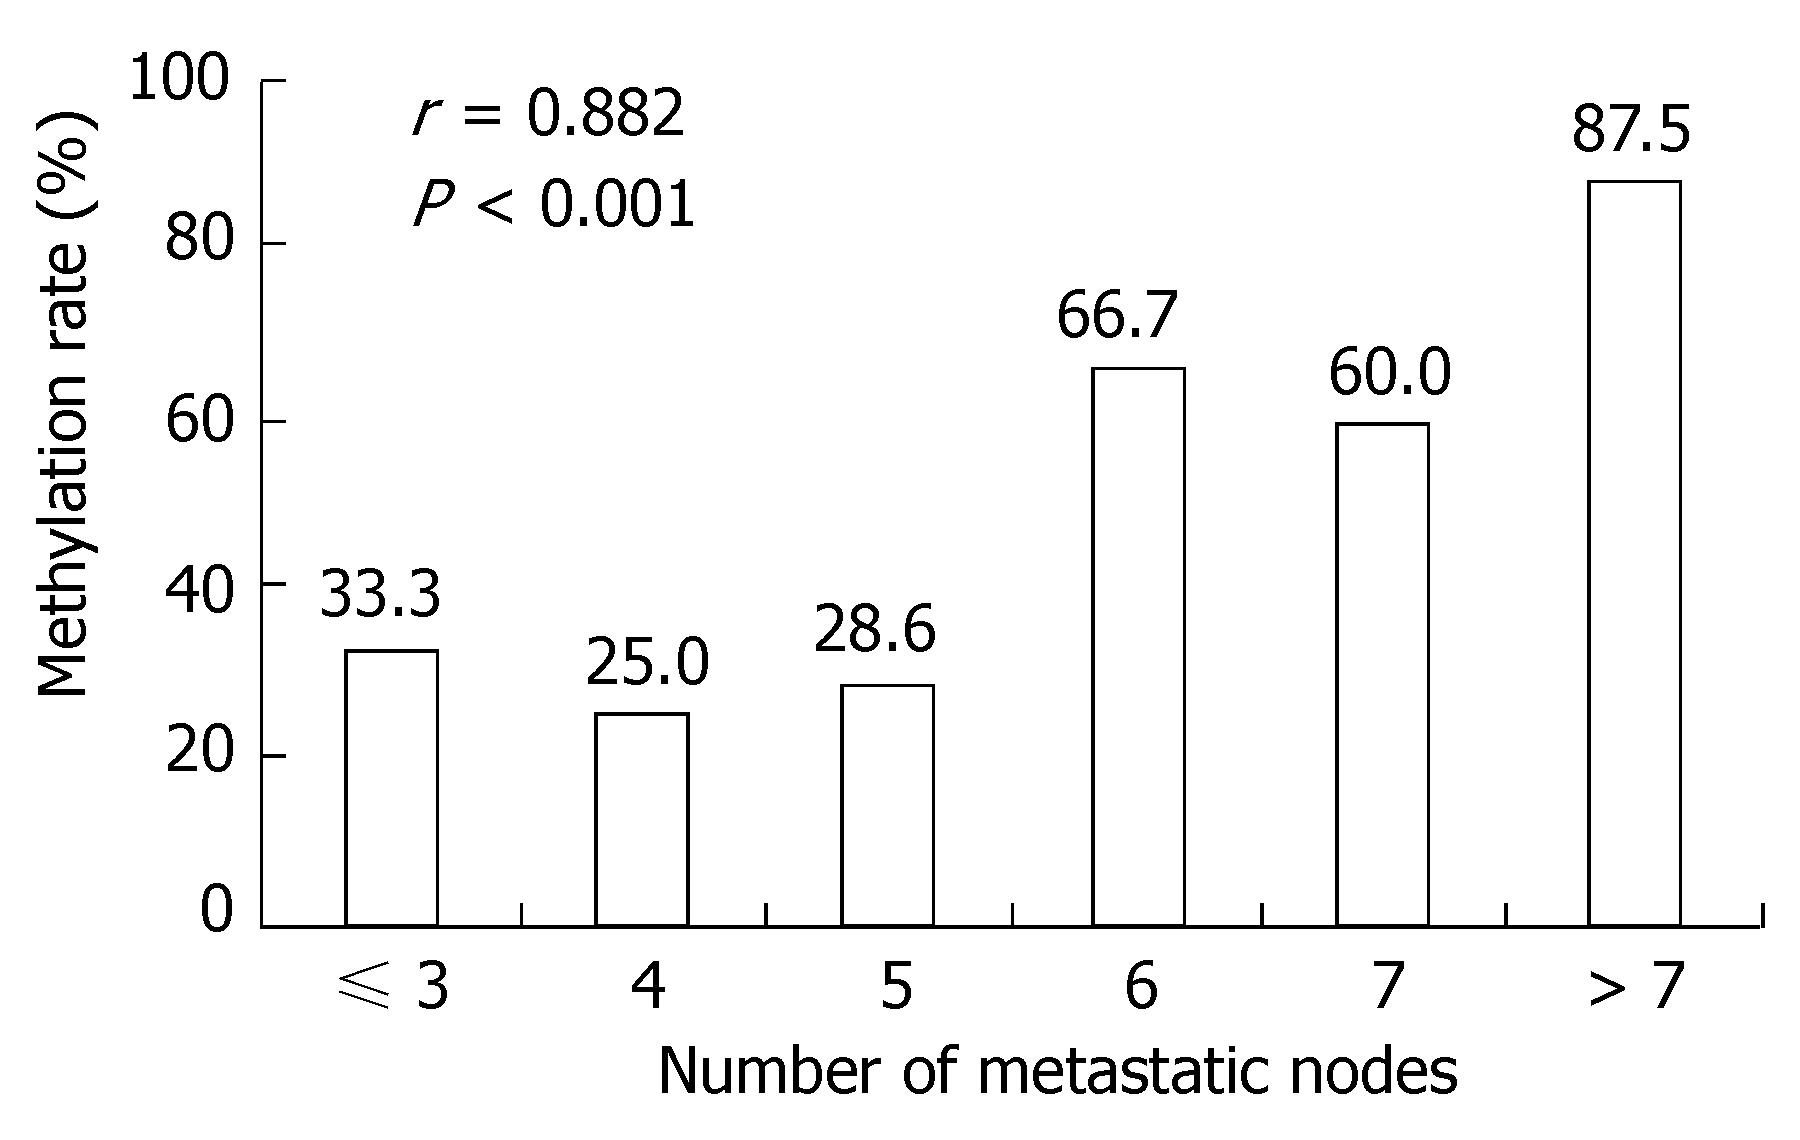
Figure 4 Relationship between number of metastatic lymph nodes and positive rate of PTPRG methylation.
Figure 5 PTPRG mRNA expression of gastric cancer tissues and metastatic lymph nodes.
M: Marker. Gastric cancer tissues: Products of PTPRG gene (177 bp) of gastric cancer tissues; Metastatic lymph nodes: Products of PTPRG gene (177 bp) of metastatic lymph nodes; β-actin: 483 bp. RT-PCR showed a positive strap at 177 bp in gene PTPRG of primary tumor, with a positive rate of 50.0% (18/36), while a 177-bp positive band was observed in metastatic lymph nodes, with a positive rate of 25.0% (9/36) (P < 0.05).
Figure 6 Methylation-specific PCR (MSP) of gene PTPRG in gastric cell line before and after the treatment with 5-aza-2'-deoxycytidine.
M: Marker; U: Unmethylated; M: Methylated. Before the treatment, a positive band was observed at 158 bp in unmethylated PCR, while a positive band was seen at 150 bp in methylated PCR of gastric cancer cell line. After the treatment, a positive band was also observed at 158 bp in unmethylated PCR, but no positive band was seen in methylated PCR.
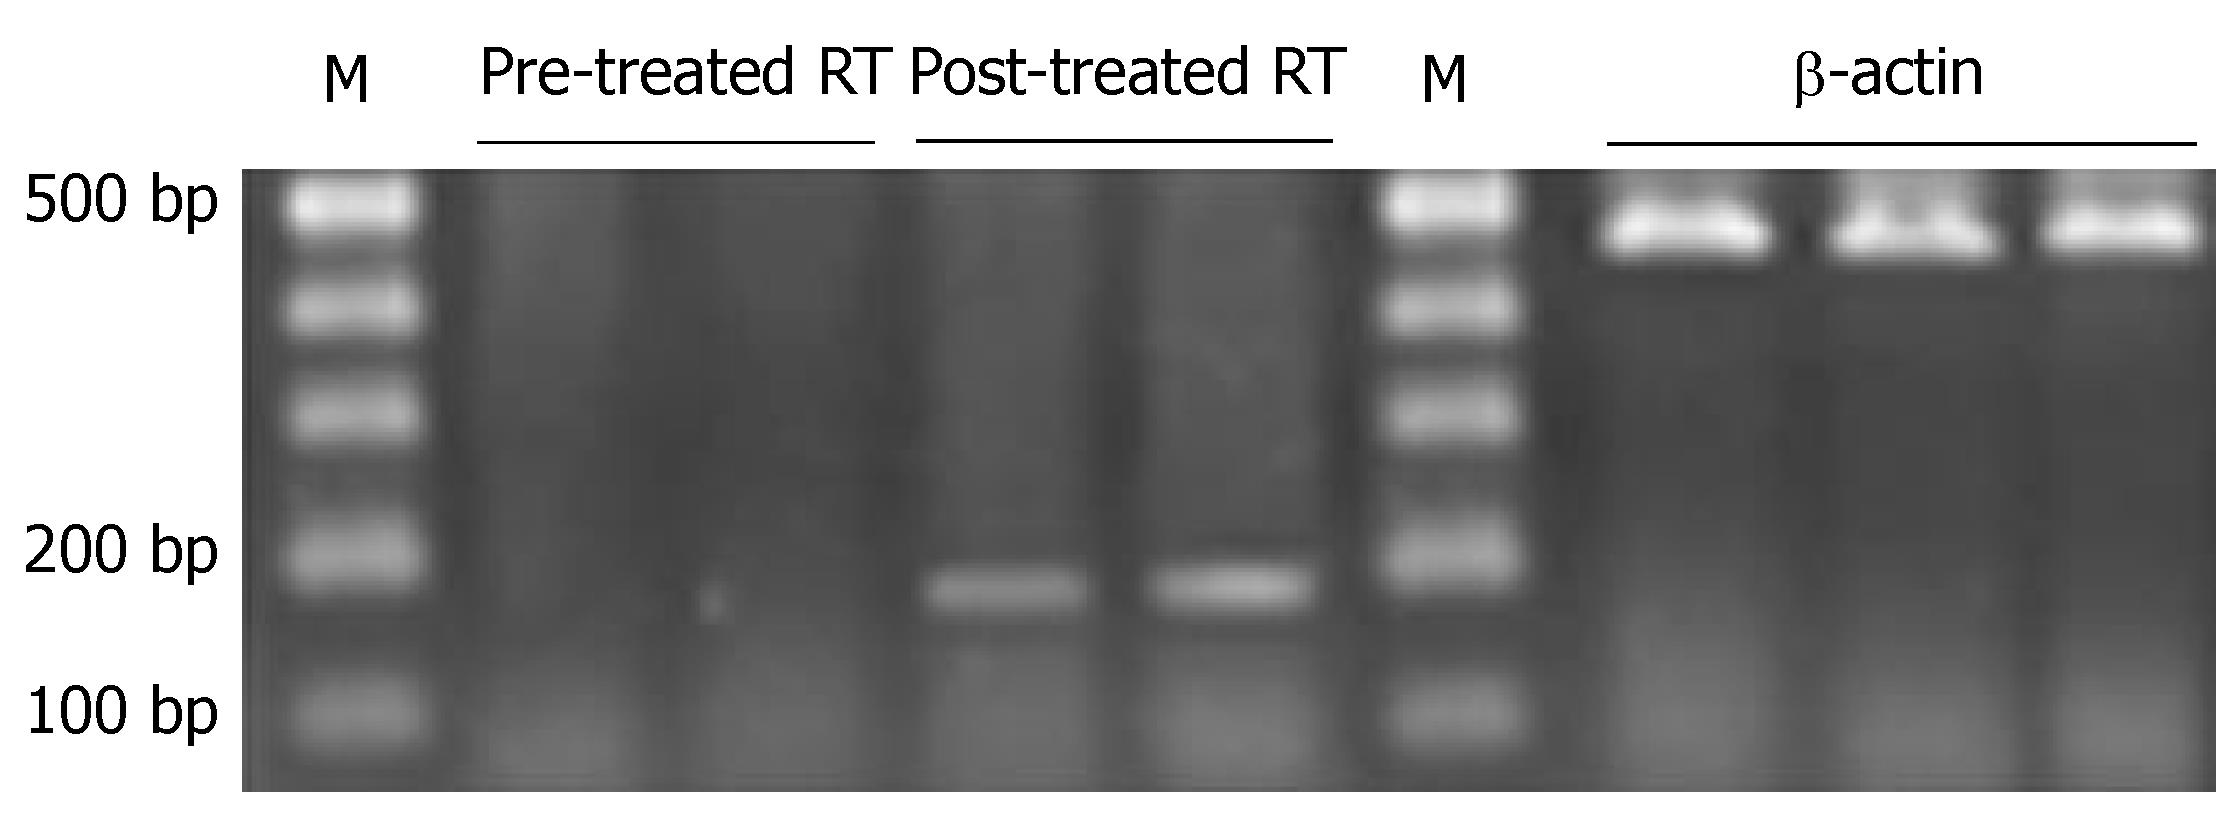
Figure 7 PTPRG mRNA expression of cell line before and after the treatment with 5-aza-2'-deoxycytidine.
M: Marker; Pre-treated RT: PTPRG mRNA expression before the treatment with 5-aza-2'-deoxycytidine; Post-treated RT: PTPRG mRNA expression after the treatment with 5-aza-2'-deoxycytidine.
- Citation: Wang JF, Dai DQ. Metastatic suppressor genes inactivated by aberrant methylation in gastric cancer. World J Gastroenterol 2007; 13(43): 5692-5698
- URL: https://www.wjgnet.com/1007-9327/full/v13/i43/5692.htm
- DOI: https://dx.doi.org/10.3748/wjg.v13.i43.5692


