Copyright
©2007 Baishideng Publishing Group Co.
World J Gastroenterol. Jan 28, 2007; 13(4): 538-547
Published online Jan 28, 2007. doi: 10.3748/wjg.v13.i4.538
Published online Jan 28, 2007. doi: 10.3748/wjg.v13.i4.538
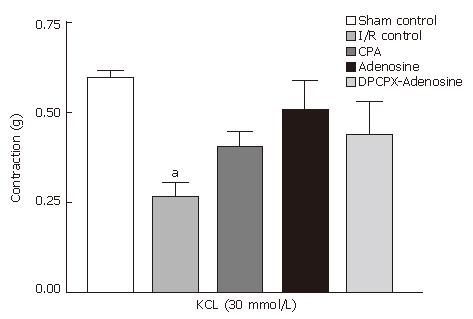
Figure 1 Mean contraction of longitudinal ileum muscle isolated from sham-operated control, I/R control, CPA-I/R, adenosine-I/R, and DPCPX-adenosine-I/R rats in response to 30 mmol/L KCl.
Data are expressed as means ± SE (n = 8). aP < 0.05 vs sham-operated control group.
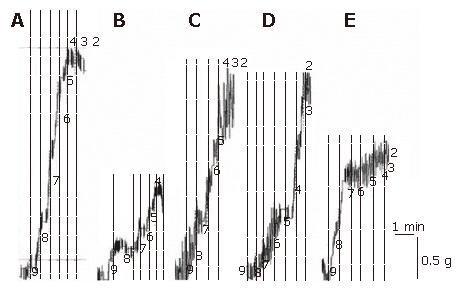
Figure 2 Representative traces showing responses generated by various concentrations of carbachol in longitudinal ileum muscle isolated from sham-operated control (A), I/R control (B), CPA–I/R (C), adenosine-I/R (D), and DPCPX-adenosine-I/R (E) rats.
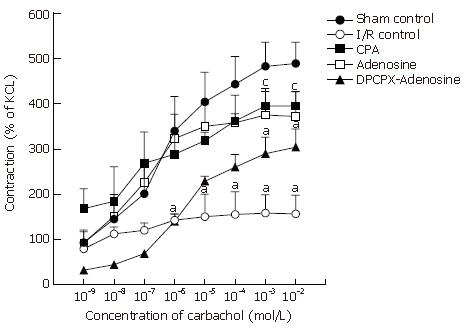
Figure 3 Dose-response curves of carbachol in longitudinal ileum muscle isolated from sham-operated control, I/R control, CPA-I/R, adenosine-I/R, and DPCPX-adenosine-I/R rats.
Data are expressed as means ± SE (n = 8). aP < 0.05 vs sham-operated control, cP < 0.05 vs I/R control groups.
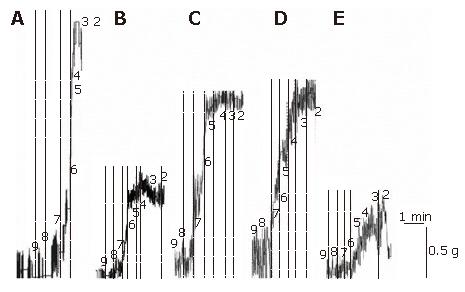
Figure 4 Representative traces showing responses generated by various concentrations of substance P in longitudinal ileum muscle isolated from sham-operated control (A), I/R control (B), CPA-I/R (C), adenosine-I/R (D), and DPCPX-adenosine-I/R (E) rats.
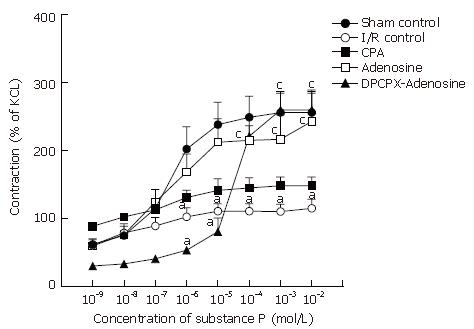
Figure 5 Dose-response curves of substance P in longitudinal ileum muscle isolated from sham-operated control, I/R control, CPA-I/R, adenosine-I/R, and DPCPX-adenosine-I/R rats.
Data are expressed as means ± SE (n = 8). aP < 0.05 vs sham-operated control, cP < 0.05 vs I/R control groups.
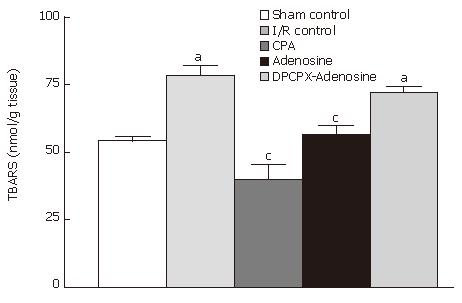
Figure 6 TBARS content of ileum samples from sham-operated control, I/R control, CPA-I/R, adenosine-I/R, and DPCPX-adenosine-I/R rats.
Data are expressed as means ± SE (n = 8). aP < 0.05 vs sham-operated control, cP < 0.05 vs I/R control groups.
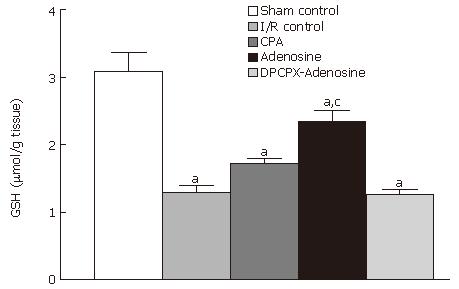
Figure 7 GSH content of ileum samples from sham-operated control, I/R control, CPA-I/R, adenosine-I/R, and DPCPX-adenosine-I/R rats.
Data are expressed as means ± SE (n = 8). aP < 0.05 vs sham-operated control, cP < 0.05 vs I/R control groups.
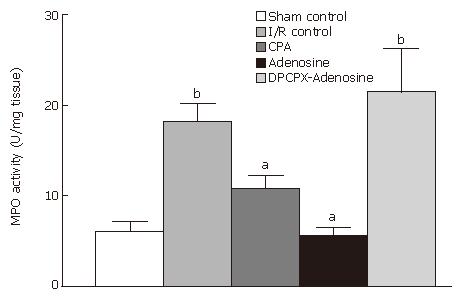
Figure 8 MPO level of ileum samples from sham-operated control, I/R control, CPA-I/R, adenosine-I/R, and DPCPX-adenosine-I/R animals.
Results are the means ± SE of 6 to 8 animals in each group. aP < 0.05 vs I/R control, bP < 0.001 vs sham-operated control.
- Citation: Ozacmak VH, Sayan H. Pretreatment with adenosine and adenosine A1 receptor agonist protects against intestinal ischemia-reperfusion injury in rat. World J Gastroenterol 2007; 13(4): 538-547
- URL: https://www.wjgnet.com/1007-9327/full/v13/i4/538.htm
- DOI: https://dx.doi.org/10.3748/wjg.v13.i4.538


