Copyright
©2007 Baishideng Publishing Group Co.
World J Gastroenterol. Sep 14, 2007; 13(34): 4593-4597
Published online Sep 14, 2007. doi: 10.3748/wjg.v13.i34.4593
Published online Sep 14, 2007. doi: 10.3748/wjg.v13.i34.4593
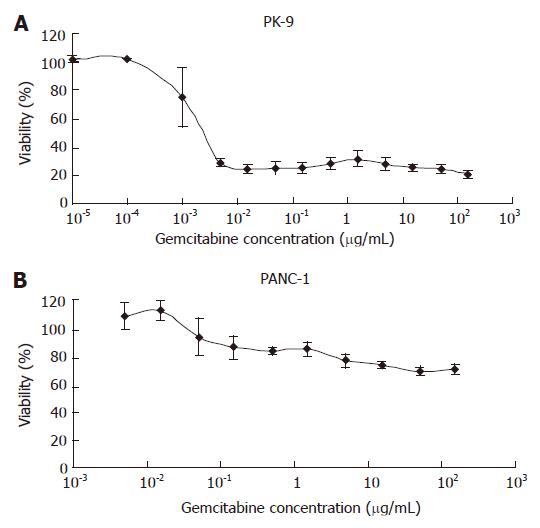
Figure 1 Response to gemcitabine in pancreatic cancer cell lines.
Dose-response curves for gemcitabine in PK-9 (A) and PANC-1 (B). These are representative gemcitabine-sensitive and -resistant cell lines, respectively. Each bar represent a standard deviation (SD).
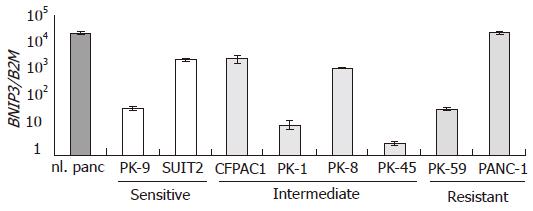
Figure 2 Relative expression levels of BNIP3 in eight pancreatic cancer cell lines.
BNIP3 expression in pancreatic cancer cell lines as determined by quantitative real-time RT-PCR, and the expression of B2M was monitored as the internal control. The cell lines are arranged by IC50 for gemcitabine. No significant correlation was observed between the expression level of BNIP3 and IC50.
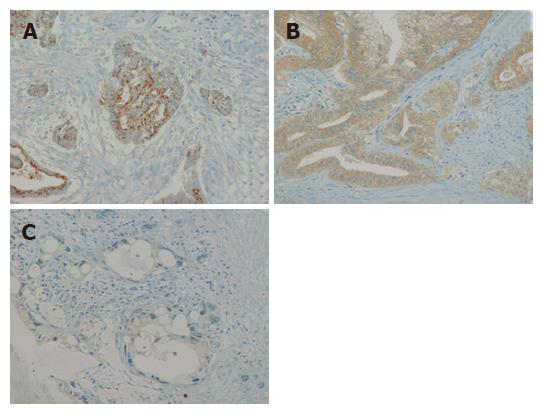
Figure 3 Immunohistochemical analysis of BNIP3 in primary pancreatic cancer specimens.
A monoclonal anti-BNIP3 antibody (clone Ana 40) was used. A: Punctate perinuclear staining; B: Diffuse cytoplasmic staining; C: Negative/faint staining.
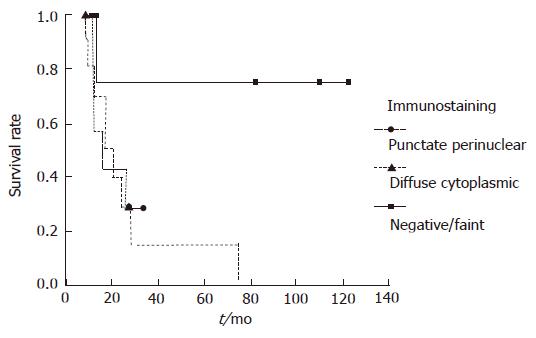
Figure 4 Kaplan-Meyer analysis of the patients with pancreatic cancer by BNIP3 immunostaining patterns.
The mean survival time of patients with punctate perinuclear staining group was 20 mo, diffuse cytoplasmic staining group was 26 mo, and negative/faint-staining group was 95 mo. Each group was comparable in terms of tumor stage and adjuvant therapies.
- Citation: Ishida M, Sunamura M, Furukawa T, Akada M, Fujimura H, Shibuya E, Egawa S, Unno M, Horii A. Elucidation of the relationship of BNIP3 expression to gemcitabine chemosensitivity and prognosis. World J Gastroenterol 2007; 13(34): 4593-4597
- URL: https://www.wjgnet.com/1007-9327/full/v13/i34/4593.htm
- DOI: https://dx.doi.org/10.3748/wjg.v13.i34.4593


