Copyright
©2007 Baishideng Publishing Group Co.
World J Gastroenterol. Aug 21, 2007; 13(31): 4192-4198
Published online Aug 21, 2007. doi: 10.3748/wjg.v13.i31.4192
Published online Aug 21, 2007. doi: 10.3748/wjg.v13.i31.4192
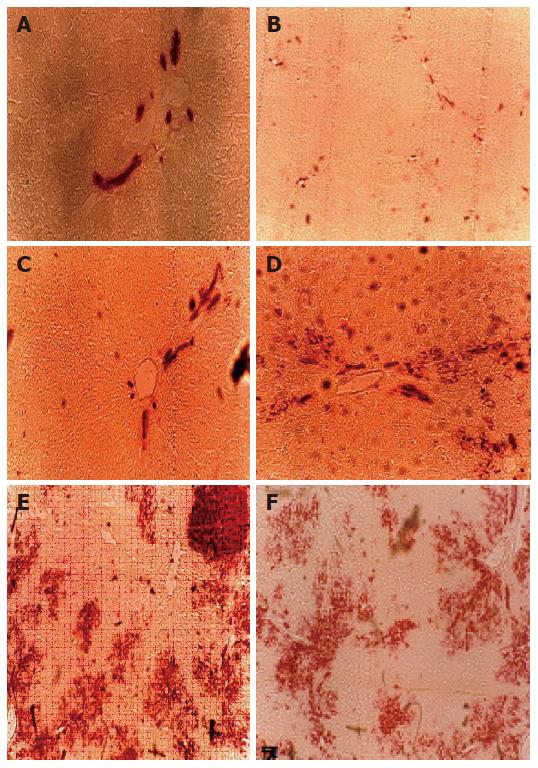
Figure 1 GTase expression in liver sections from the normal control group (A), treated group with PH (removed the greater part liver of rat alone) (B), Huqi San- given group one week before preparation of mode rats (C), large dose therapeutic group (8 g/kg body weight) (D), model group (DEN + 2-AAF + PH) (E) and small dose therapeutic group (4 g/kg body weight) (F).
The red stained areas are the -GTase positive foci with various sizes.
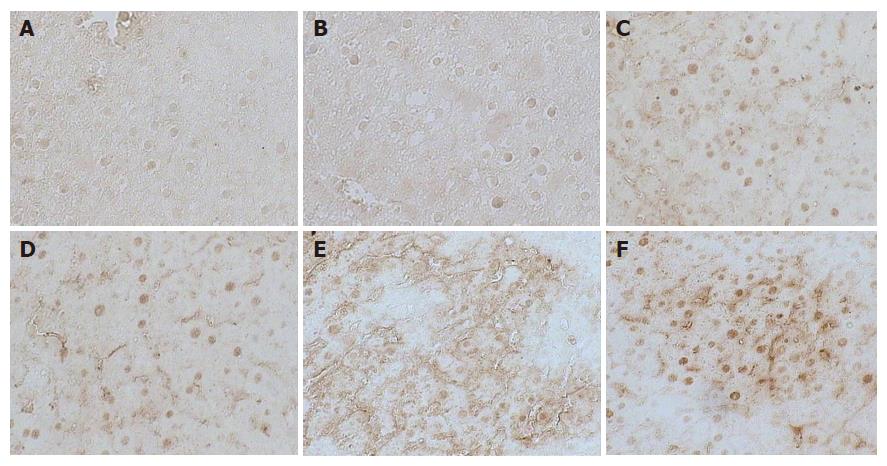
Figure 2 Immunohistochemical examination of c-jun expression in liver sections from the normal control group (A), treated group with PH (removed the greater part of liver from rats alone) (B), Huqi Sangiven one week before the preparation of model rats (C), large dose therapeutic group (8 g/kg body weight) (D), model group (DEN + 2-AAF + PH) (E) and small dose therapeutic group (4 g/kg body weight) (F).
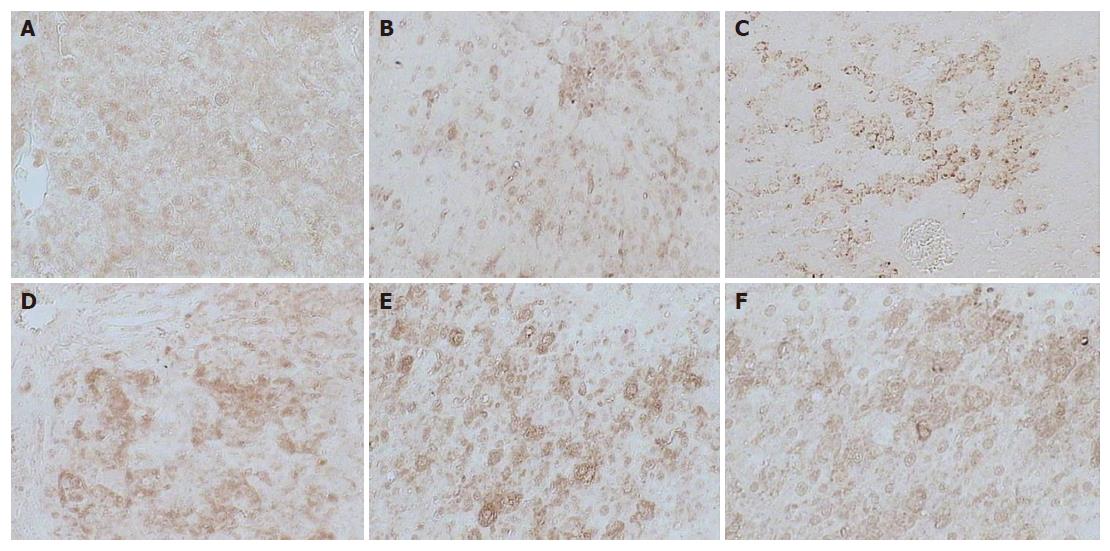
Figure 3 Immunohistochemical examination for c-fos expression in liver sections obtained from the normal control group (A), treated group with PH (removed the greater part of liver from rats alone) (B), Huqi San group given one week before preparation of model rats (C), large dose therapeutic Huqi San group (8 g/ kg body weight) (D), model group (DEN + 2-AAF + PH) (E) and small dose therapeutic Huqi San group (4 g/kg body weight) (F).
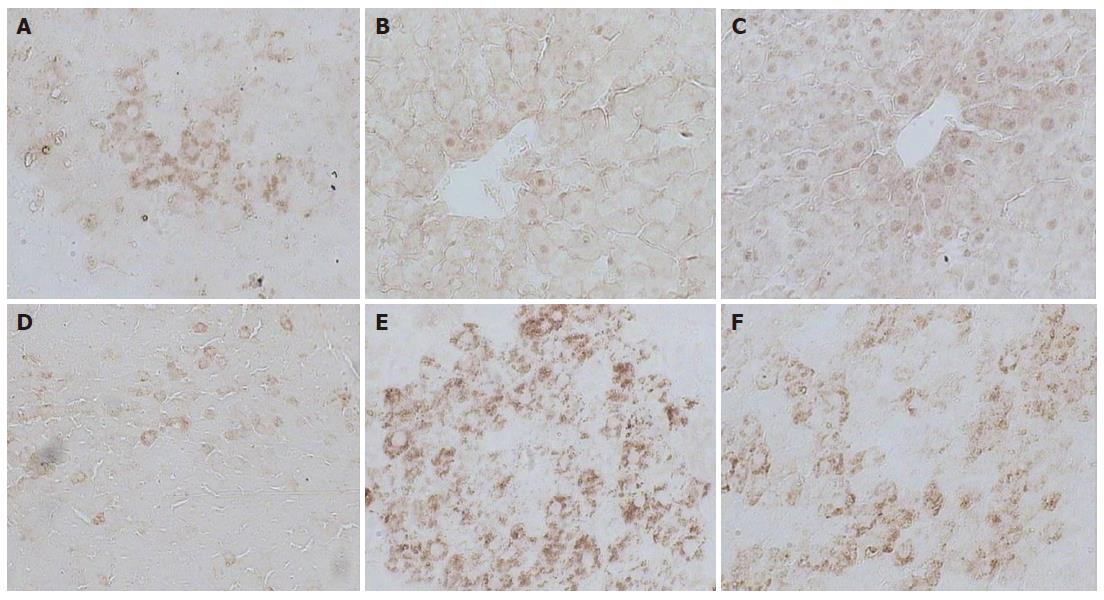
Figure 4 Immunohistochemical examination of c-myc expression in liver sections from the normal control group (A), treated group with PH (removed the greater part of liver from rats alone) (B), Huqi San-given group one week before preparation of model rats) (C), large dose therapeutic group (8 g/kg body weight) (D), model group (DEN + 2-AAF + PH) (E) and small dose therapeutic group (4 g/kg body weight) (F).
- Citation: Li X, Shi ZM, Feng P, Wen ZY, Wang XJ. Effect of Qi-protecting powder (Huqi San) on expression of c-jun, c-fos and c-myc in diethylnitrosamine-mediated hepatocarcinogenesis. World J Gastroenterol 2007; 13(31): 4192-4198
- URL: https://www.wjgnet.com/1007-9327/full/v13/i31/4192.htm
- DOI: https://dx.doi.org/10.3748/wjg.v13.i31.4192


