Copyright
©2007 Baishideng Publishing Group Co.
World J Gastroenterol. Apr 7, 2007; 13(13): 1953-1961
Published online Apr 7, 2007. doi: 10.3748/wjg.v13.i13.1953
Published online Apr 7, 2007. doi: 10.3748/wjg.v13.i13.1953
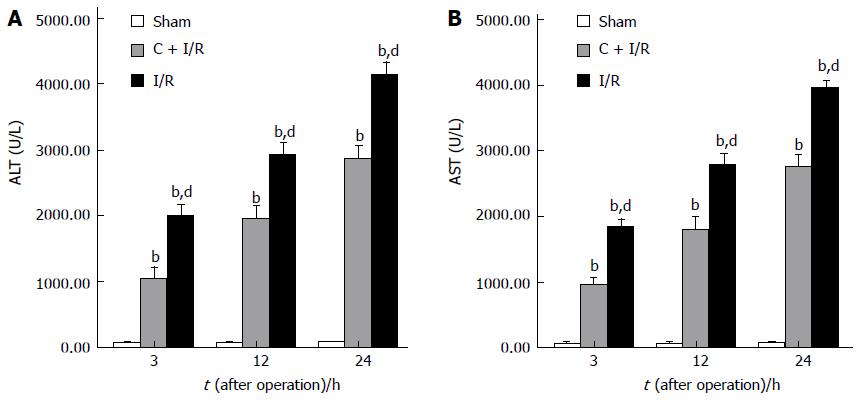
Figure 1 Significantly increased serum conce-ntrations of ALT (A) and AST (B) after reperfusion as compared with the sham group.
Curcumin pretreatment significantly reduced the hepatic I/R-related elevation of ALT and AST levels. bP < 0.01 vs Sham group; dP < 0.01 vs C + I/R group. Error bars represent the 95% CI.
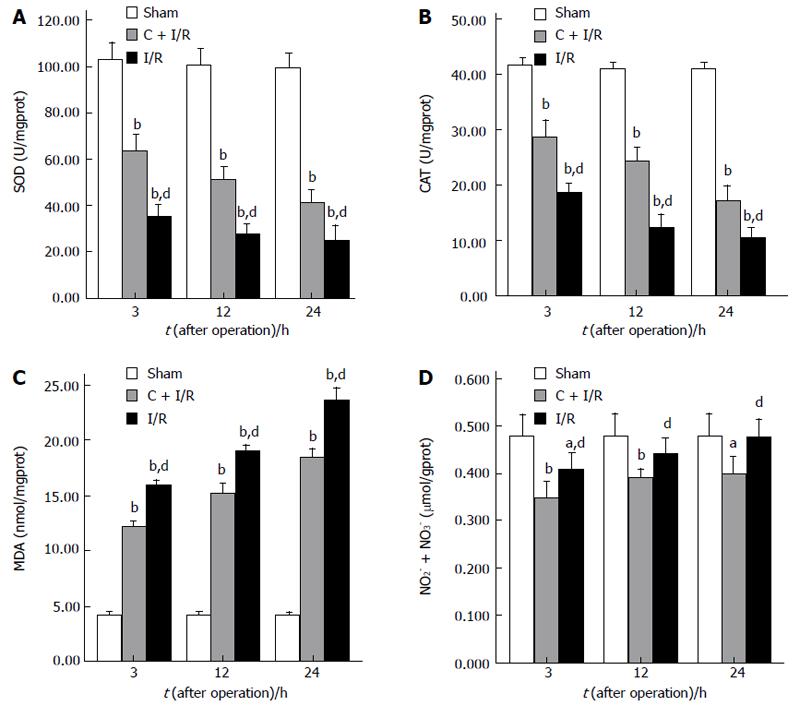
Figure 2 The results of SOD activity (A), CAT activity (B), MDA content (C), and total NO2- + NO3- level (D) in liver tissue.
Curcumin pretreatment significantly reduced MDA content and total NO2- + NO3- levels, and increased CAT and SOD activity as compared to I/R group. aP < 0.05, bP < 0.01 vs Sham group; dP < 0.01 vs C + I/R group. Error bars represent the 95% CI.
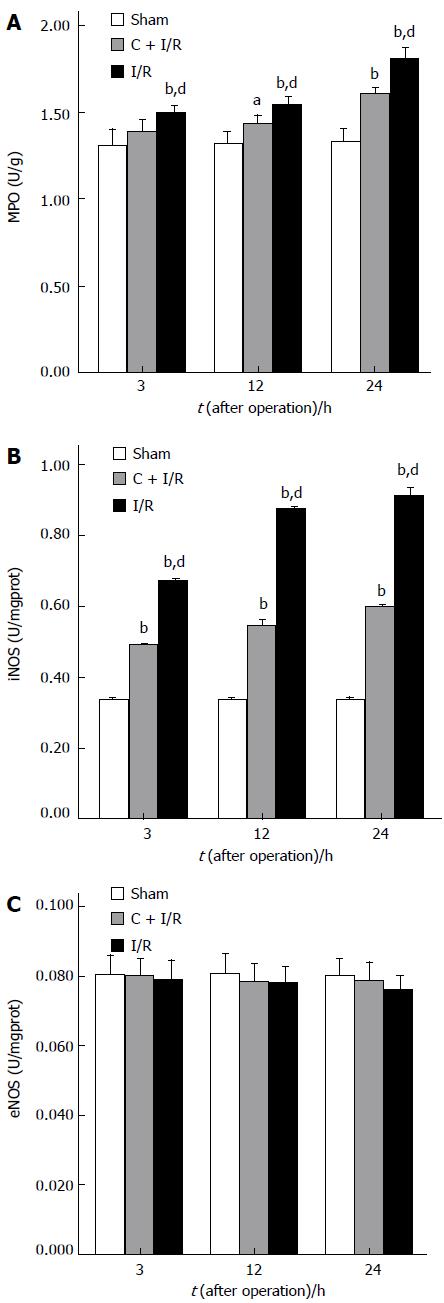
Figure 3 Activity of MPO (A), iNOS (B), and eNOS (C) in liver tissue.
aP < 0.05, bP < 0.01 vs sham group; dP < 0.01 vs C + I/R group. Error bars represent the 95% CI.
Figure 4 Expression of β-actin mRNA and Hsp70 mRNA in I/R group and C + I/R group.
6: 24 h after I/R in I/R group; 5: 24 h after I/R in C + I/R group; 4:12 h after I/R in I/R group; 3: 12 h after I/R in C + I/R group; 2: 3 h after I/R in I/R group; 1: 3 h after I/R in C + I/R group.
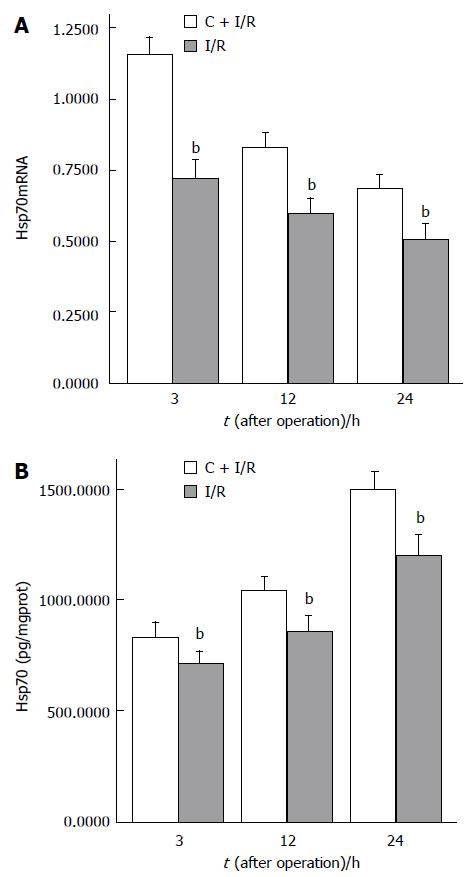
Figure 5 Expression of Hsp70mRNA (A) and Hsp70 (B) in C + I/R group increased after liver reperfusion as compared with I/R group.
bP < 0.01 vs C + I/R group. Error bars represent the 95% confidence intervals.
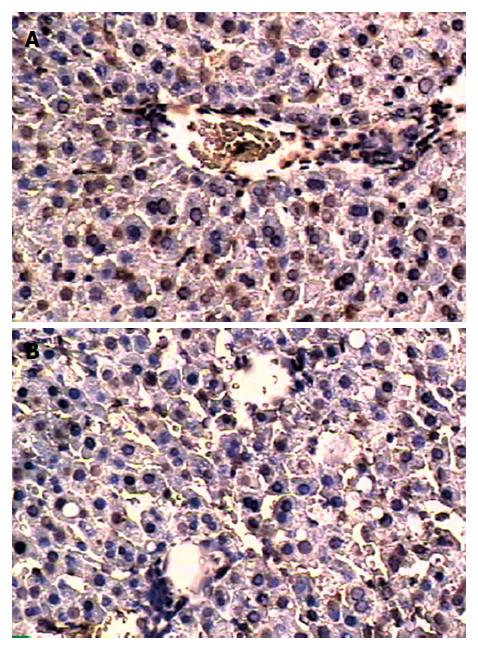
Figure 6 In situ terminal deoxynucleotidyl transferase-mediated biotin-dUTP nick end labeling method for apoptosis detection in I/R group (A) and C + I/R group (B) at 24 h after operation.
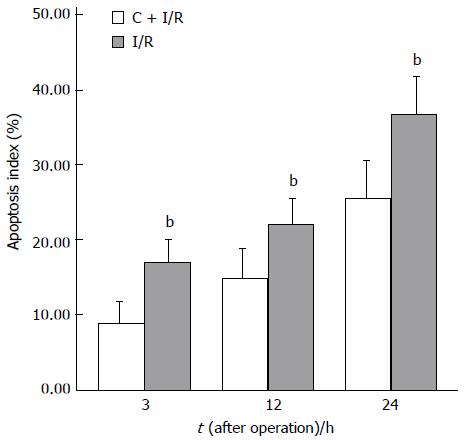
Figure 7 Apoptosis index (analyzed in situ terminal deoxynucleotidyl transferase-mediated biotin-dUTP nick end labeling method) in C + I/R group after liver reperfusion as compared with I/R group.
bP < 0.01 vs E2 + I/R group. Error bars represent the 95% CI.
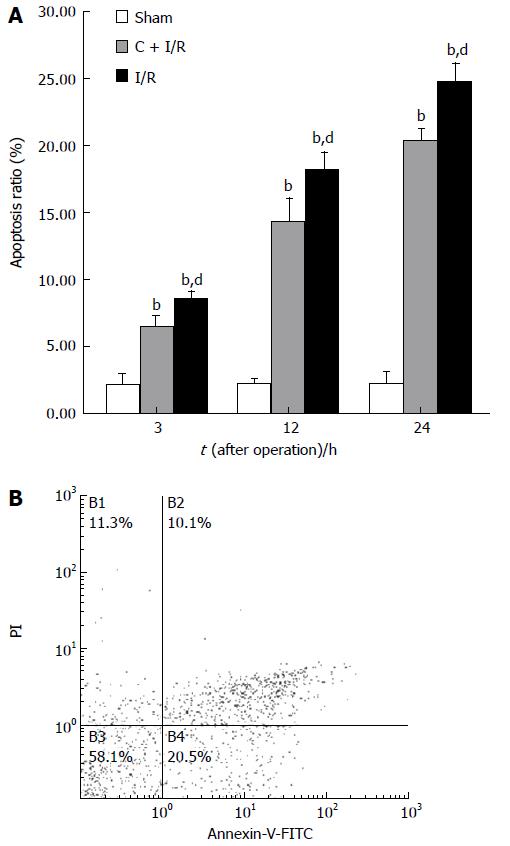
Figure 8 Apoptosis ratio (analyzed by flow cytometry method) in C + I/R group after liver reperfusion as compared with sham group (A) and I/R group (B).
bP < 0.01 vs sham group; dP < 0.01 vs C + I/R group. Error bars represent the 95% CI.
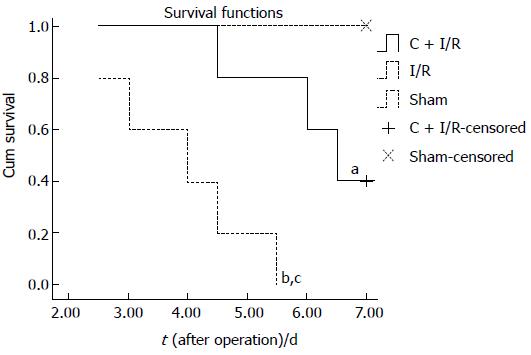
Figure 9 Seven-day-survival was significantly higher in C + I/R group than in I/R group.
aP < 0.05, bP < 0.01 vs Sham group; cP < 0.05 vs C + I/R group.
- Citation: Shen SQ, Zhang Y, Xiang JJ, Xiong CL. Protective effect of curcumin against liver warm ischemia/reperfusion injury in rat model is associated with regulation of heat shock protein and antioxidant enzymes. World J Gastroenterol 2007; 13(13): 1953-1961
- URL: https://www.wjgnet.com/1007-9327/full/v13/i13/1953.htm
- DOI: https://dx.doi.org/10.3748/wjg.v13.i13.1953


