Copyright
©2007 Baishideng Publishing Group Co.
World J Gastroenterol. Apr 7, 2007; 13(13): 1938-1946
Published online Apr 7, 2007. doi: 10.3748/wjg.v13.i13.1938
Published online Apr 7, 2007. doi: 10.3748/wjg.v13.i13.1938
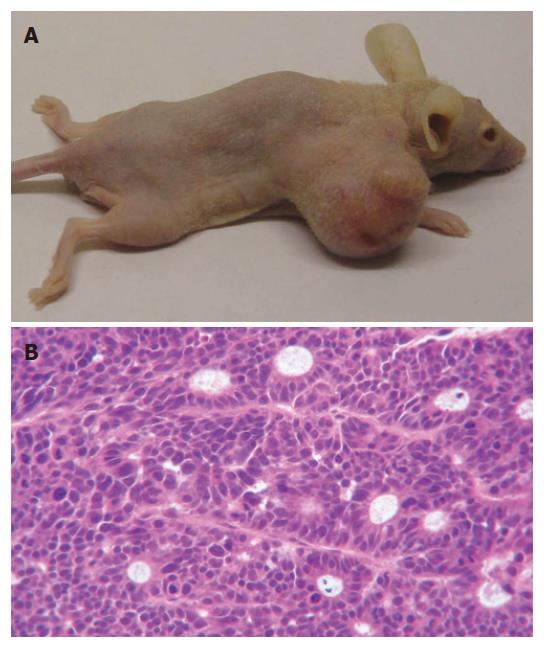
Figure 1 Tumors established in athymic BALB/c mice by subcutaneous injection of LS174T cells.
A: Photography of subcutaneous tumor of LS174T in athymic mice; B: The tumor sections (HE, × 200).
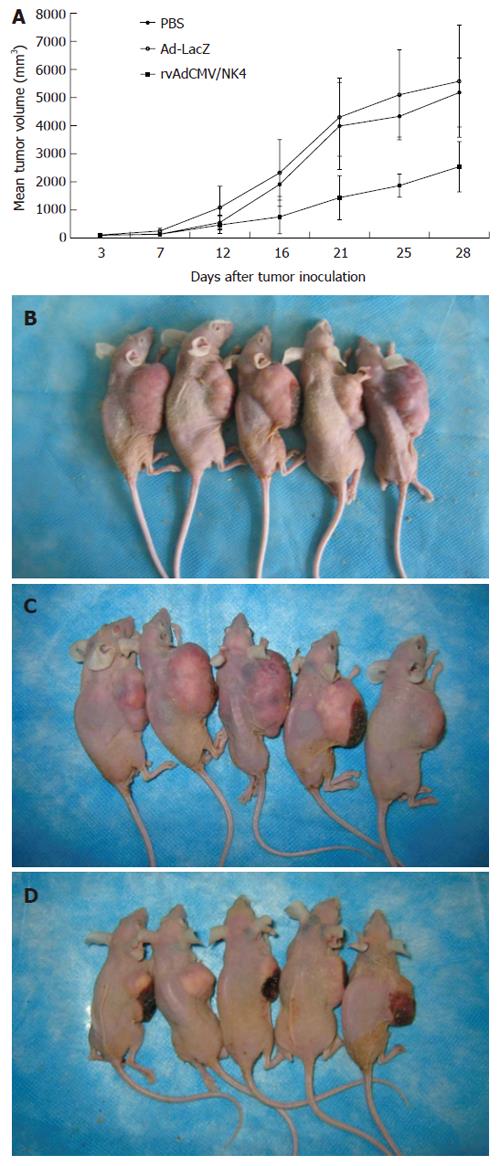
Figure 2 Suppression of LS174T tumor growth in athymic mice by intratumoral administration of rvAdCMV/NK4.
A: Tumor growth curves. Data are presented as mean ± SD (n = 5/group); B: PBS control; C: Ad-LacZ; D: rvAdCMV/NK4.
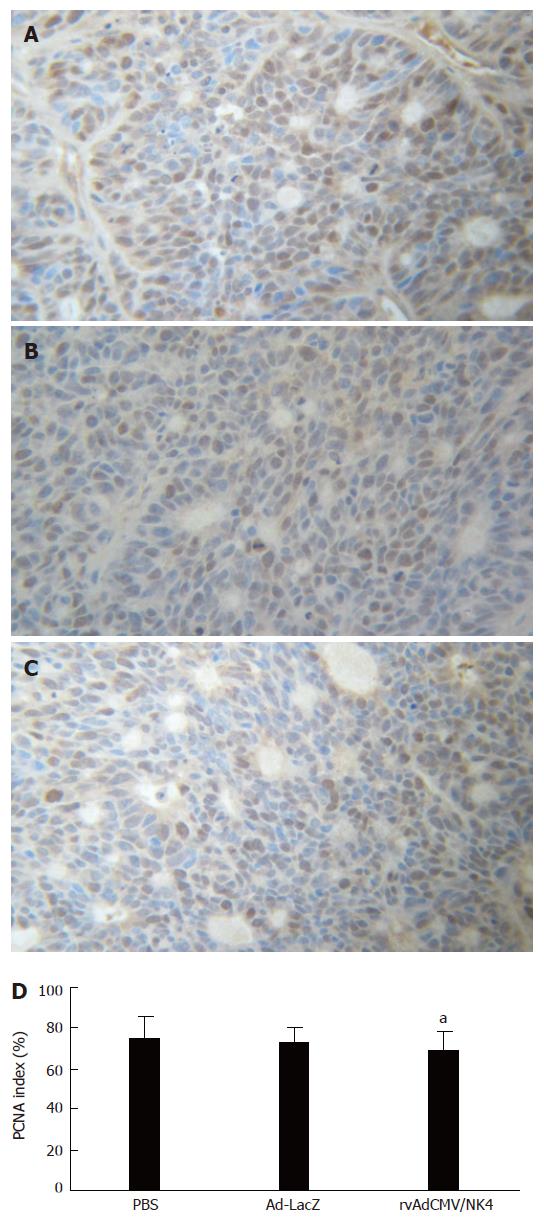
Figure 3 PCNA expression in LS174T tumors after rvAdCMV/NK4 treatment.
A, B, C: Immmunohistochemical staining of PCNA in tumor tissues (× 200), A: PBS; B: Ad-LacZ; C: rvAdCMV/NK4; D: PCNA labeling index in different groups (mean ± SD). aР > 0.05 vs PBS/Ad-LacZ.
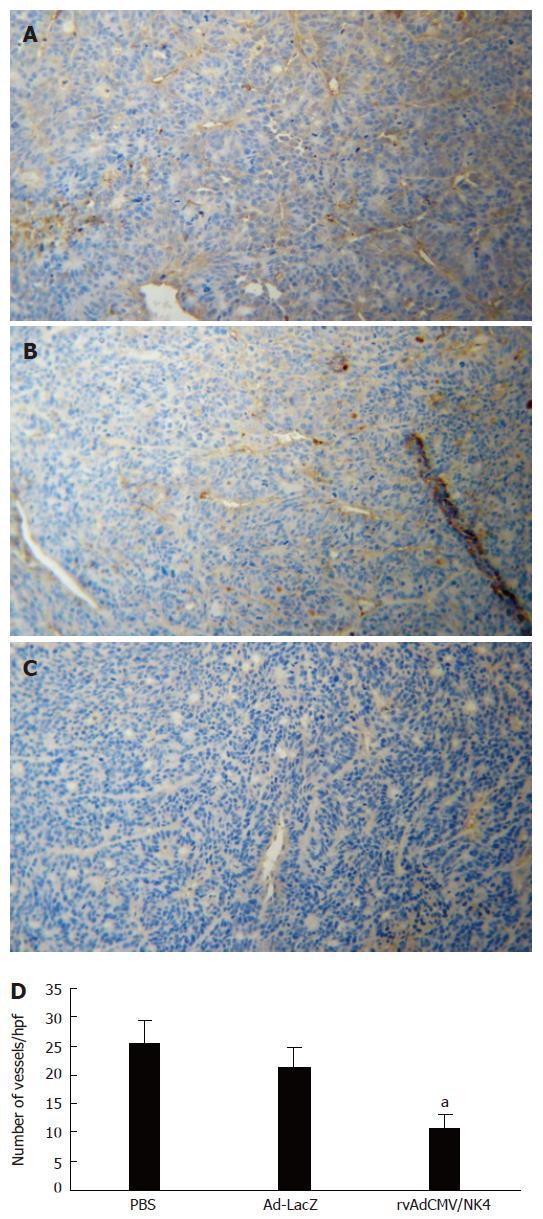
Figure 4 Microvessel density of LS174T tumors in athymic mice after rvAdCMV/NK4 treatment.
A, B, C: Immmunohistochemical staining of CD31 in tumor tissues (× 100), A: PBS; B: Ad-LacZ; C: rvAdCMV/NK4; D: Number of vessels in tumor tissues after treatment (mean ± SD). aР < 0.05 vs PBS or Ad-LacZ.
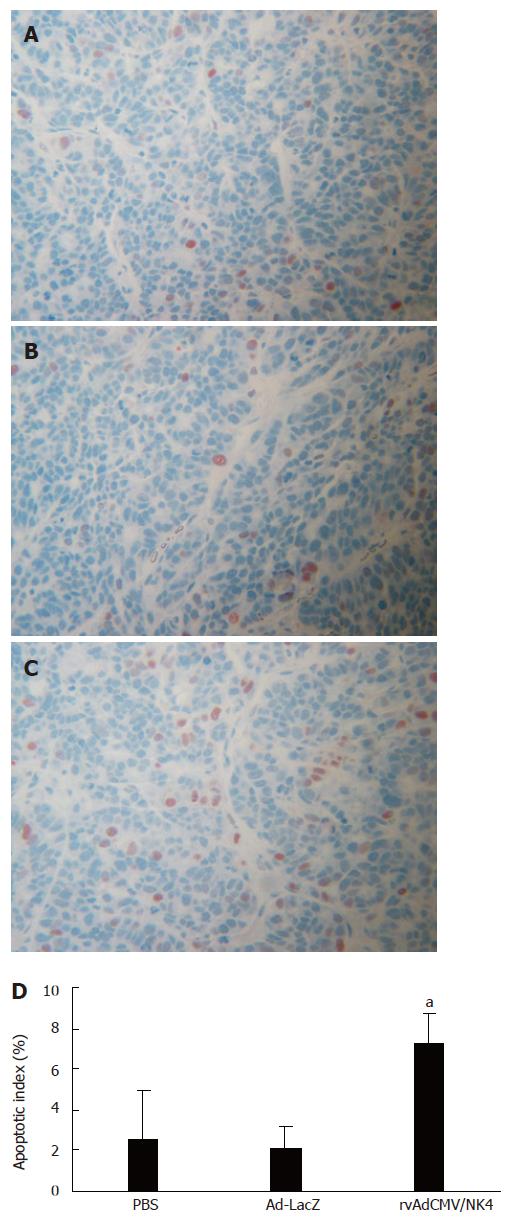
Figure 5 Apoptosis in LS174T tumors in athymic mice after treatment.
A, B, C: Apototic cells stained by TUNEL assay (× 200), A: PBS; B: Ad-LacZ; C: rvAdCMV/NK4; D: Apoptotic index in different groups (mean ± SD). aР < 0.05 vs PBS or Ad-LacZ.
Figure 6 Suppression of peritoneal dissemination by intraperitoneal injection of rvAdCMV/NK4.
A, B, C: Macroscopic appearance of peritoneal dissemination on d 14 after the treatment following peritoneal implantation of 1 × 10⁶ LS174T cells (n = 5/group), A: PBS; B: Ad-LacZ; C: rvAdCMV/NK4. Arrowheads indicate disseminated tumor nodules; D: Number of disseminated foci (mean ± SD); E: Total weight of disseminated foci (mean ± SD). aР < 0.05 vs PBS or Ad-LacZ.
- Citation: Jie JZ, Wang JW, Qu JG, Hung T. Suppression of human colon tumor growth by adenoviral vector-mediated NK4 expression in an athymic mouse model. World J Gastroenterol 2007; 13(13): 1938-1946
- URL: https://www.wjgnet.com/1007-9327/full/v13/i13/1938.htm
- DOI: https://dx.doi.org/10.3748/wjg.v13.i13.1938


