Copyright
©2007 Baishideng Publishing Group Co.
World J Gastroenterol. Mar 28, 2007; 13(12): 1788-1793
Published online Mar 28, 2007. doi: 10.3748/wjg.v13.i12.1788
Published online Mar 28, 2007. doi: 10.3748/wjg.v13.i12.1788
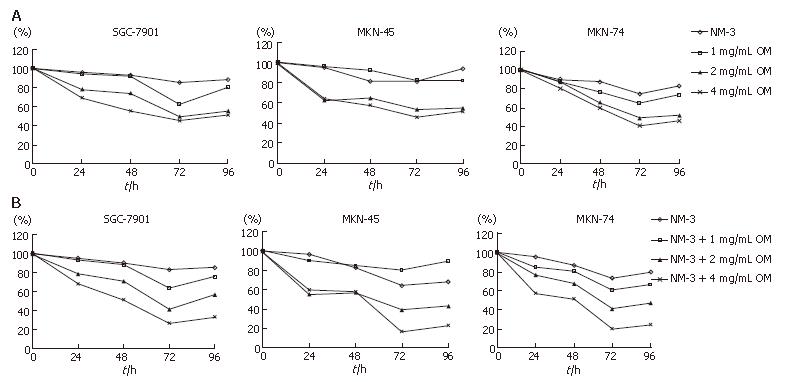
Figure 1 Growth inhibitory effects of OM alone and in combination with NM-3 on 3 gastric cancer cell lines, SGC-7901, MKN-45 and MNK-74.
A: MTT assays were performed to examine the growth inhibitory effect of OM alone. Clear growth inhibition was observed in a time- and dose- dependent manner in each of the gastric cancer cell lines; B: Growth inhibitory effects of OM combined with NM-3. The concentrations of OM used are indicated for each symbol.
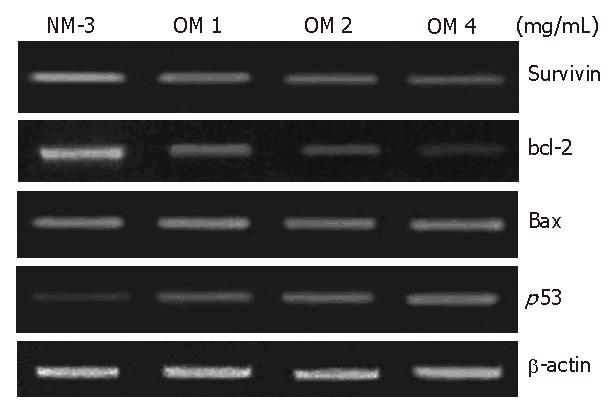
Figure 2 After 24 h treatment identification of differentially expressed survivin, bcl-2, bax, p53, β-actin genes in human gastric cancer line SGC-7901 by means of semiquantitative RT-PCR.
NM-3 signifies NM-3 alone; OM 1 mg/mL signifies OM 1 mg/mL combined with NM-3; OM 2 mg/mL signifies OM 2 mg/mL combined with NM-3; OM 4 mg/mL signifies OM 4 mg/mL combined with NM-3.
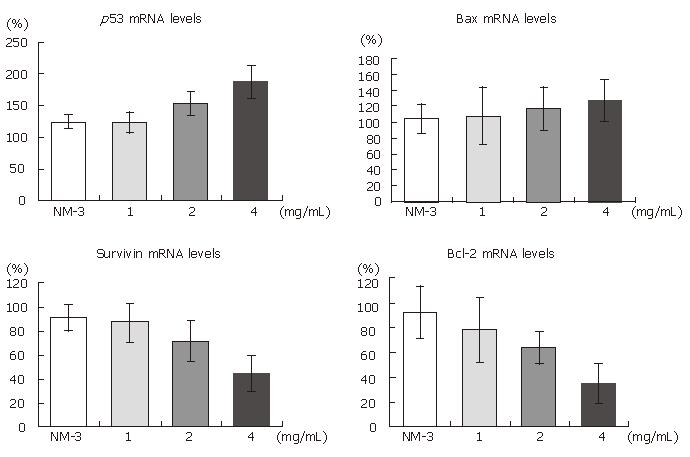
Figure 3 Differentially expressed mRNA histograms of survivin, bcl-2, bax, p53, β-actin genes in human gastric cancer line SGC-7901 after 24 h treatment.
There are significant differences in expression of survivin bcl-2 and p53 mRNA between the NM-3 and NM-3 combined OM 4 mg/mL groups (P < 0.05).
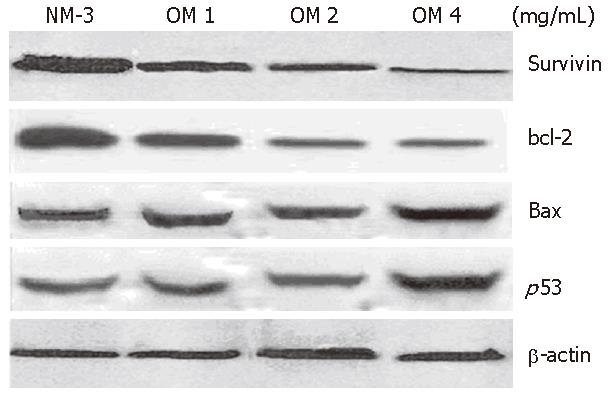
Figure 4 Western blotting analysis showing expression of survivin bcl-2 bax and p53 in human gastric cancer line SGC-7901 after 24 h treatment.
NM-3 signifies NM-3 alone; OM 1 mg/mL signifies OM 1 mg/mL combined with NM-3; OM 2 mg/mL signifies OM 2 mg/mL combined with NM-3; OM 4 mg/mL signifies OM 4 mg/mL combined with NM-3.
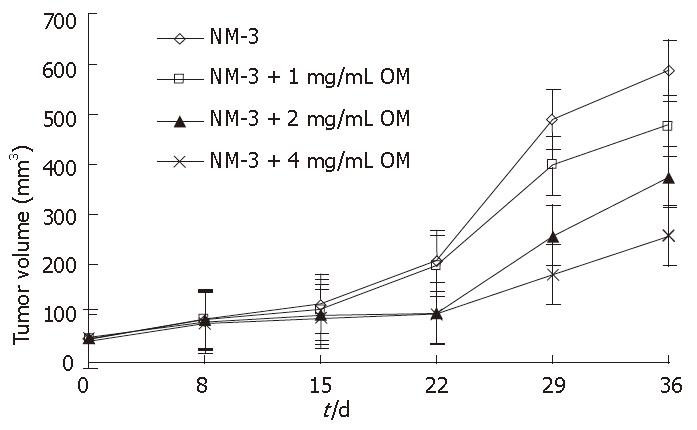
Figure 5 Curve lines of mean tumor volume (mm3) of nude mice with xenografted human gastric cancer in different groups, effects of NM-3 alone and 1 mg/mL, 2 mg/mL, 4 mg/mL OM combined with NM-3 on gastric tumor volume in 36 d.
- Citation: Song MQ, Zhu JS, Chen JL, Wang L, Da W, Zhu L, Zhang WP. Synergistic effect of oxymatrine and angiogenesis inhibitor NM-3 on modulating apoptosis in human gastric cancer cells. World J Gastroenterol 2007; 13(12): 1788-1793
- URL: https://www.wjgnet.com/1007-9327/full/v13/i12/1788.htm
- DOI: https://dx.doi.org/10.3748/wjg.v13.i12.1788


