Copyright
©2007 Baishideng Publishing Group Co.
World J Gastroenterol. Mar 21, 2007; 13(11): 1666-1671
Published online Mar 21, 2007. doi: 10.3748/wjg.v13.i11.1666
Published online Mar 21, 2007. doi: 10.3748/wjg.v13.i11.1666
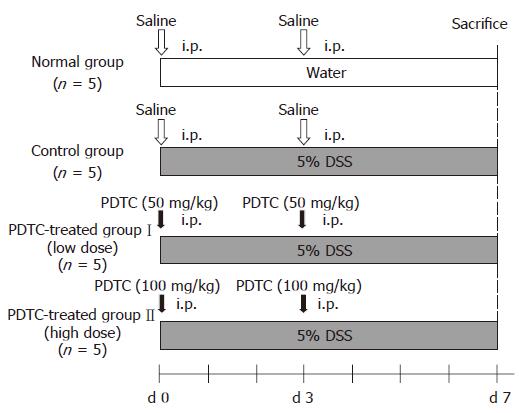
Figure 1 Method of DSS colitis model and administration of PDTC.
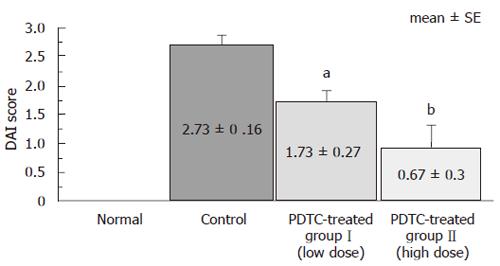
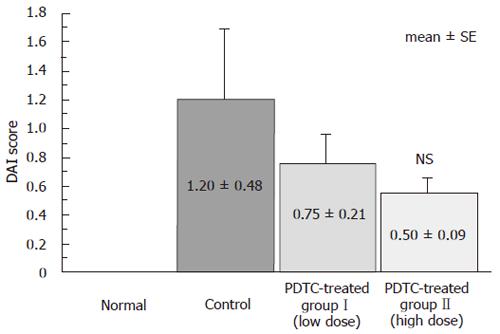
Figure 2 The effect of PDTC on clinical indices (DAI).
aP < 0.05, bP < 0.01, vs control group.
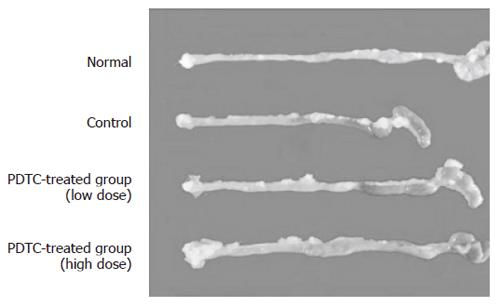
Figure 3 Comparison of length of colon in different groups.
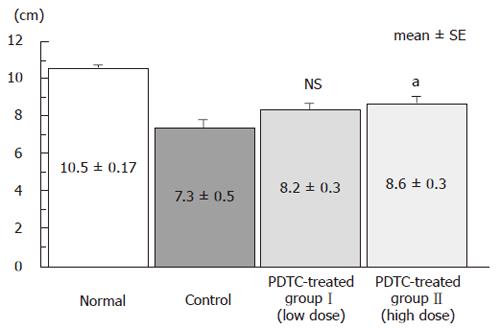
Figure 4 The effect of PDTC on length of colon.
aP < 0.05, P = NS, vs control group. NS: not significant.
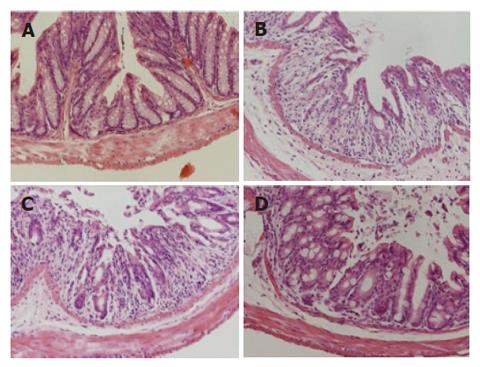
Figure 5 Histological findings of distal colon in mouse.
A: normal; B: control; C: PDTC-treated groupI (low dose); D: PDTC-treated group II (high dose).
Figure 6 The effect of PDTC on histological disease score.
P = NS vs control group. NS: not significant.
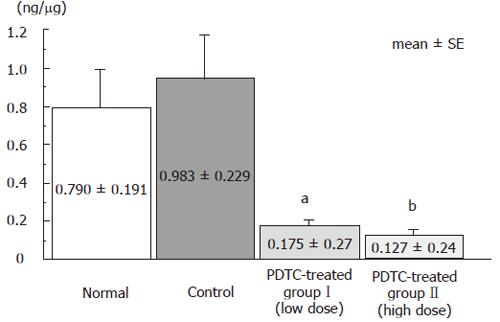
Figure 7 The effect of PDTC on NF-κ concentration.
aP < 0.05, bP < 0.01, vs control group.
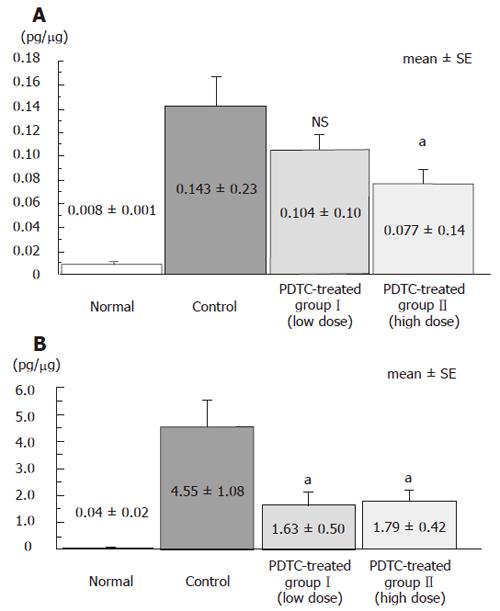
Figure 8 A: The effect of PDTC on IL-1β cytokine concentration.
aP < 0.05, P = NS, vs control group. NS: not significant; B: The effect of PDTC on TNF-α cytokine concentration. aP < 0.05 vs control group.
- Citation: Hirata I, Yasumoto S, Toshina K, Inoue T, Nishikawa T, Murano N, Murano M, Wang FY, Katsu KI. Evaluation of the effect of pyrrolidine dithiocarbamate in suppressing inflammation in mice with dextran sodium sulfate-induced colitis. World J Gastroenterol 2007; 13(11): 1666-1671
- URL: https://www.wjgnet.com/1007-9327/full/v13/i11/1666.htm
- DOI: https://dx.doi.org/10.3748/wjg.v13.i11.1666


