Copyright
©2006 Baishideng Publishing Group Co.
World J Gastroenterol. Mar 7, 2006; 12(9): 1439-1442
Published online Mar 7, 2006. doi: 10.3748/wjg.v12.i9.1439
Published online Mar 7, 2006. doi: 10.3748/wjg.v12.i9.1439
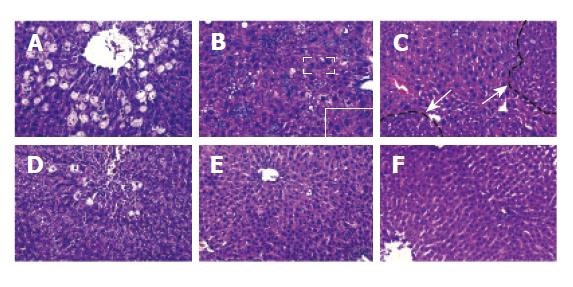
Figure 1 Pathological analysis of rat liver.
A: Much more severe hepatocyte balloon degeneration and necrosis in perivenous areas of retrorsine-treated group compared with non-treated group (D). B: Mild bile duct proliferation and megalocytosis (the insert showed the area enclosed in the box at high magnification). C: Proliferation of small hepatocytes formed nodules. E and F: No obvious pathological change was found in non-treated group.
Figure 2 Pathological changes of mouse liver.
A and D: No obvious morphological abnormity. B and E: Necrosis in perivenous areas, arrow indicates the mitotic figure of hepatocytes. C and F: Hepatic parenchyma in both groups became normal.
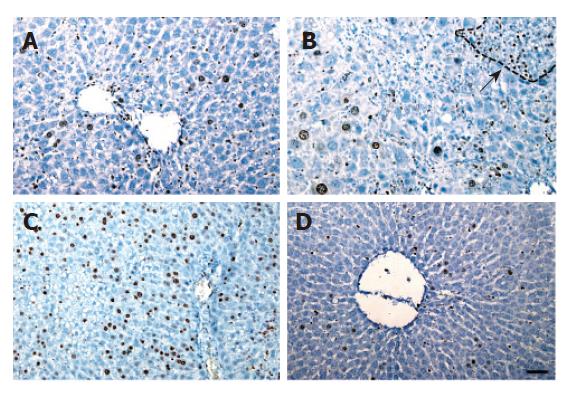
Figure 3 Ki-67 immunohistochemical analysis of rat liver.
A: A few hepatocytes were Ki-67 positive. B: Ki-67 positive hepatocytes were mainly found in small hepatocyte nodules as the arrow indicated. C: Abundant Ki-67 positive cells. D: Only a few hepatocytes were Ki-67 positive in rat liver.
Figure 4 Ki-67 immunohistochemical analysis of mouse liver.
A and C: Some Ki-67 positive cells appeared in retrorsine-treated mice on days 0 and 15. B and D: The maximum number of Ki-67 positive cells in retrorsine-treated mice on day 4. E and F: The maximum number of Ki-67 positive cells in non-treated group on day 2.
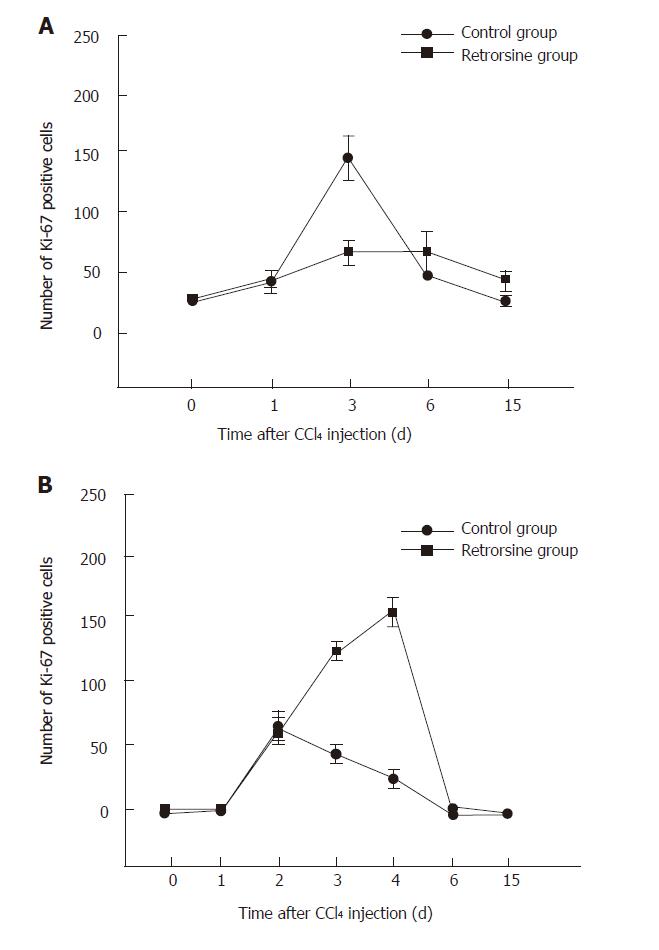
Figure 5 Kinetics of Ki-67 expression in rats (A) and mice (B) after CCl4 injection.
A: The maximum number of Ki-67 positive hepatocytes on day 6 after injection of CCl4 in retrorsine-treated rats and on day 3 in non-treated group. B: The number of Ki-67 positive hepatocytes in retrorsine-treated mice was higher than that in non-treated group delayed. aP < 0.05, bP < 0.01, cP < 0.001 vs control group.
- Citation: Zhou XF, Wang Q, Chu JX, Liu AL. Effects of retrorsine on mouse hepatocyte proliferation after liver injury. World J Gastroenterol 2006; 12(9): 1439-1442
- URL: https://www.wjgnet.com/1007-9327/full/v12/i9/1439.htm
- DOI: https://dx.doi.org/10.3748/wjg.v12.i9.1439


