Copyright
©2006 Baishideng Publishing Group Co.
World J Gastroenterol. Feb 28, 2006; 12(8): 1219-1224
Published online Feb 28, 2006. doi: 10.3748/wjg.v12.i8.1219
Published online Feb 28, 2006. doi: 10.3748/wjg.v12.i8.1219
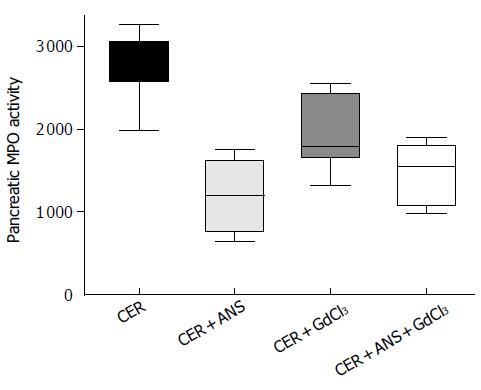
Figure 1 Pancreatic myeloperoxidase (MPO, U/mL tissue dry weight) activity in mice injected with cerulein and saline (CER), cerulein and antineutrophil serum (CER + ANS), cerulein and gadolinium chloride (CER + GdCl3), CER + ANS + GdCl3.
n ≥ 5 in each group. Kruskall Wallis analysis with Dunn posthoc test found a significant difference between CER and CER + ANS or CER + ANS + GdCl3 mice.
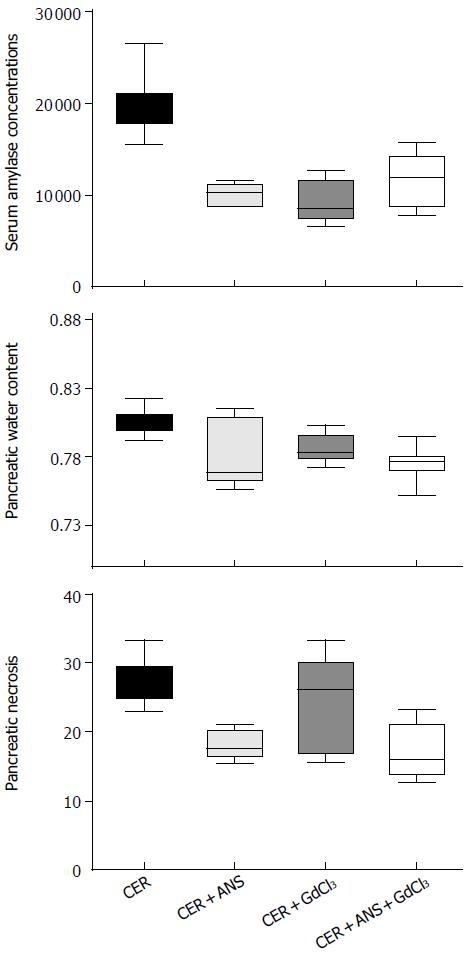
Figure 2 Serum amylase concentration (UI/L), pancreatic water content (% wet weight), and pancretic necrosis (%) in mice injected with cerulein and saline (CER), cerulein and antineutrophil serum (CER + ANS), cerulein and gadolinium chloride (CER + GdCl3), CER + ANS + GdCl3.
n ≥ 5 in each group. Kruskall Wallis analysis with Dunn posthoc test found a significant difference between CER and CER + ANS, CER + GdCl3, and CER + ANS + GdCl3 (amylase concentrations) and CER and CER + ANS or CER + ANS + GdCl3 mice (pancreatic water content and pancreatic necrosis).
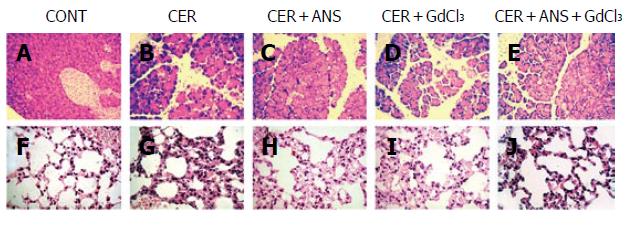
Figure 3 Representative sections of pancreas (upper panels) and lung (lower panels) stained with hematoxylin and eosin.
Mice were injected with saline solution (CONT, A and F), cerulein (CER, B to E and G to J) and treated with antineutrophil serum (CER + ANS, C and H), gadolinium chloride (CER + GdCl3, D and I) or both treatments (CER + ANS + GdCl3, E and J). These illustrations represent sections from ≥ 3 mice. Magnification x400.
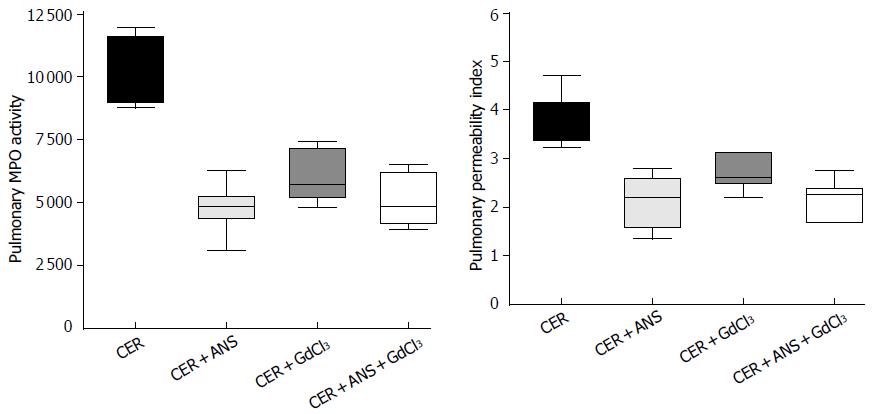
Figure 4 Pulmonary myeloperoxydase activity (MPO, U/mg tissue dry weight) and pulmonary permeability index in mice injected with cerulein and saline (CER), cerulein and antineutrophil serum (CER + ANS), cerulein and gadolinium chloride (CER + GdCl3), CER + ANS + GdCl3.
n ≥ 5 in each group. Kruskall Wallis analysis with Dunn posthoc test found a significant difference between CER and CER + ANS or CER + ANS + GdCl3 mice (pulmonary MPO and permeability index).
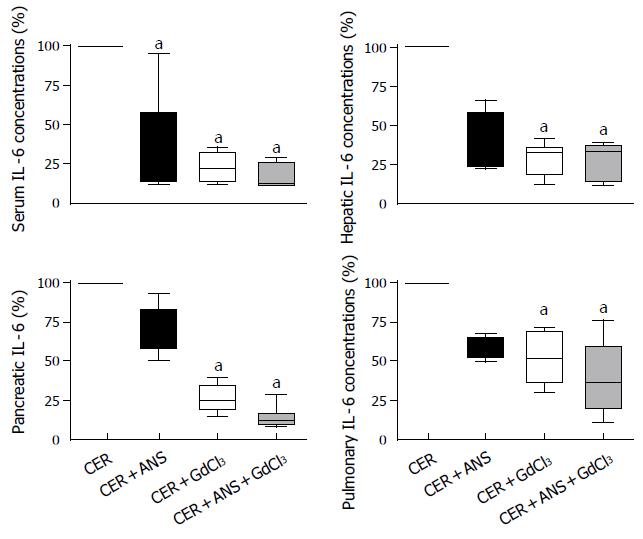
Figure 5 Interleukin-6 (IL-6, %) concentrations in serum, pancreas, lung and liver the 100% value corresponding to the mean value measured in mice injected with cerulein (CER).
Mice were injected with cerulein and saline (CER), cerulein and antineutrophil serum (CER + ANS), cerulein and gadolinium chloride (CER + GdCl3), and CER + ANS + GdCl3. n ≥ 5 in each group. aP < 0.05 vs CER.
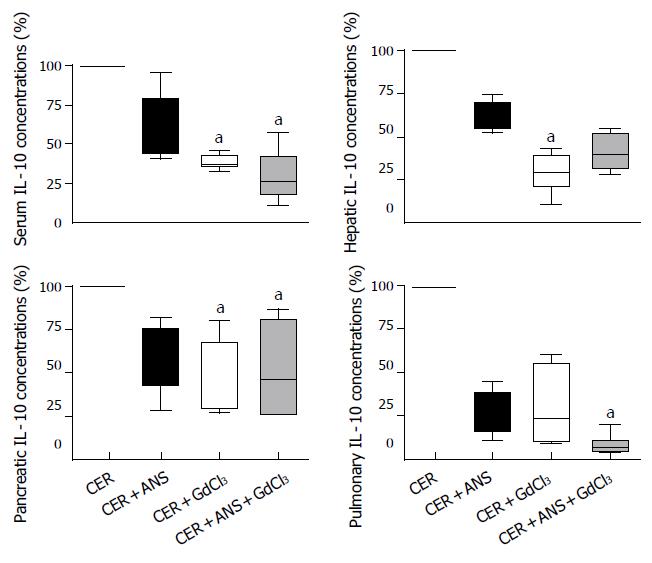
Figure 6 Interleukin-10 (IL-10, %) concentrations in serum, pancreas, lung and liver the 100% value corresponding to the mean value measured in mice injected with cerulein (CER).
Mice were injected with cerulein and saline (CER), cerulein and antineutrophil serum (CER + ANS), cerulein and gadolinium chloride (CER + GdCl3), and CER + ANS + GdCl3. n ≥ 5 in each group. aP < 0.05 vs CER.
- Citation: Pastor CM, Vonlaufen A, Georgi F, Hadengue A, Morel P, Frossard JL. Neutrophil depletion-but not prevention of Kupffer cell activation-decreases the severity of cerulein-induced acute pancreatitis. World J Gastroenterol 2006; 12(8): 1219-1224
- URL: https://www.wjgnet.com/1007-9327/full/v12/i8/1219.htm
- DOI: https://dx.doi.org/10.3748/wjg.v12.i8.1219


