Copyright
©2006 Baishideng Publishing Group Co.
World J Gastroenterol. Jul 21, 2006; 12(27): 4304-4309
Published online Jul 21, 2006. doi: 10.3748/wjg.v12.i27.4304
Published online Jul 21, 2006. doi: 10.3748/wjg.v12.i27.4304
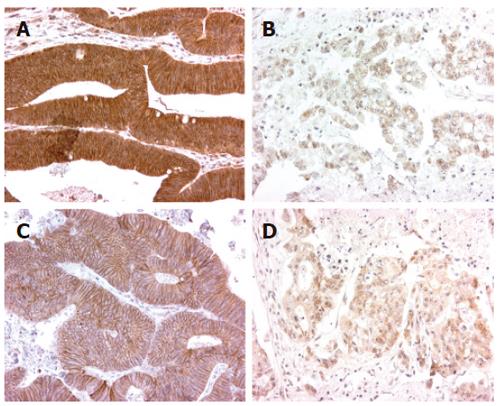
Figure 1 Immunohistochemical staining patterns.
A: Primary tumor showing high E-cadherin membranous and cytoplasmic indices (MI = 1.75, CI = 0.85); B: Metastatic disease showing low E-cadherin indices (MI = 0.40, CI = 0.25); C: Metastatic disease in the liver showing high E-cadherin indices (MI = 1.00, CI = 0.60); D: Metastatic disease in the colon showing low E-cadherin indices (MI = 0.35, CI = 0.25).
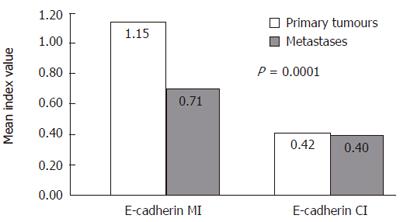
Figure 2 Comparison of E-cadherin indices in primary tumors and metastases.
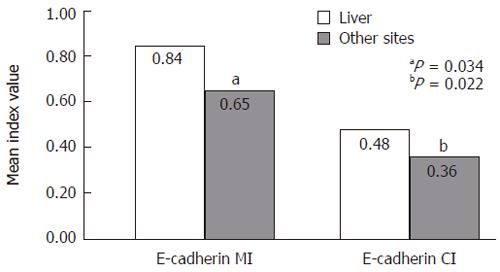
Figure 3 Comparison of E-cadherin indices and site of metastases.
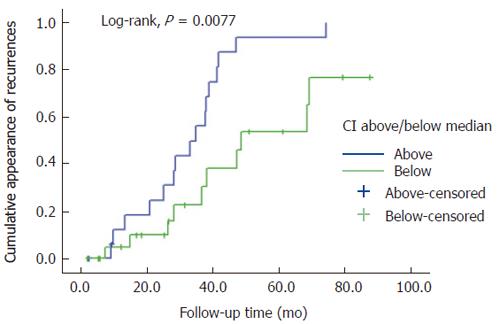
Figure 4 Association of recurrence with E-cadherin CI indices in metastases.
- Citation: Elzagheid A, Ålgars A, Bendardaf R, Lamlum H, Ristamaki R, Collan Y, Syrjanen K, Pyrhonen S. E-cadherin expression pattern in primary colorectal carcinomas and their metastases reflects disease outcome. World J Gastroenterol 2006; 12(27): 4304-4309
- URL: https://www.wjgnet.com/1007-9327/full/v12/i27/4304.htm
- DOI: https://dx.doi.org/10.3748/wjg.v12.i27.4304


