Copyright
©2006 Baishideng Publishing Group Co.
World J Gastroenterol. Jun 7, 2006; 12(21): 3450-3452
Published online Jun 7, 2006. doi: 10.3748/wjg.v12.i21.3450
Published online Jun 7, 2006. doi: 10.3748/wjg.v12.i21.3450
Figure 1 A, B: Abdominal computed tomography confirmed a 63 mm × 59 mm hepatic mass locating mainly in segment I with invasion into segment VI, VII, VIII, and V.
This tumor obstructed the posterior branch of the bile duct, and oppressed the anterior branch of the bile duct; C: Angiography revealed a hypervascular tumor in the right lobe at the early enhanced phase.
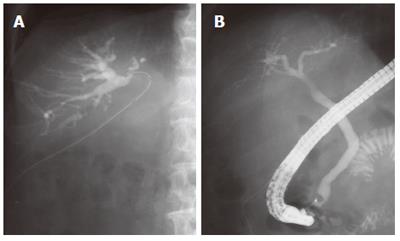
Figure 2 A: A fistulogram from the drainage tube demonstrated a connection between the anterior bile duct and fistula; B: Endoscopic retrograde cholangiography showed obstruction of the anterior bile duct, and no connection between the common bile duct and the anterior bile duct.
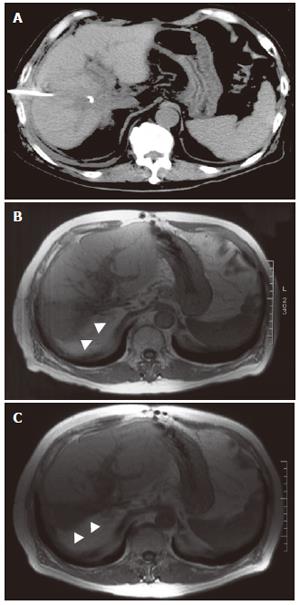
Figure 3 Follow-up computed tomography taken before ethanol injection (A), magnetic resonance imaging 3 mo (B) and 15 mo (C) after injection.
Arrows indicate the atrophy of the ethanol-injected anterior segment.
- Citation: Shimizu T, Yoshida H, Mamada Y, Taniai N, Matsumoto S, Mizuguchi Y, Yokomuro S, Arima Y, Akimaru K, Tajiri T. Postoperative bile leakage managed successfully by intrahepatic biliary ablation with ethanol. World J Gastroenterol 2006; 12(21): 3450-3452
- URL: https://www.wjgnet.com/1007-9327/full/v12/i21/3450.htm
- DOI: https://dx.doi.org/10.3748/wjg.v12.i21.3450


