Copyright
©2006 Baishideng Publishing Group Co.
World J Gastroenterol. Jun 7, 2006; 12(21): 3393-3399
Published online Jun 7, 2006. doi: 10.3748/wjg.v12.i21.3393
Published online Jun 7, 2006. doi: 10.3748/wjg.v12.i21.3393
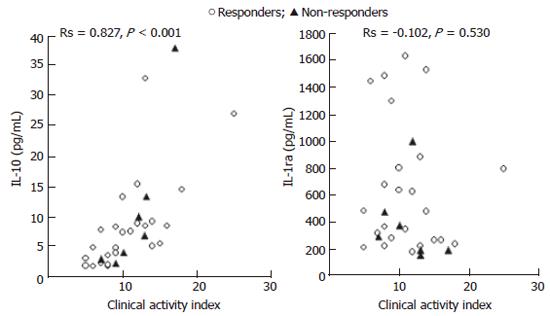
Figure 1 The relationship between blood levels of IL-10 and IL-1ra as measured in serum samples and the ulcerative colitis CAI in 31 patients with UC.
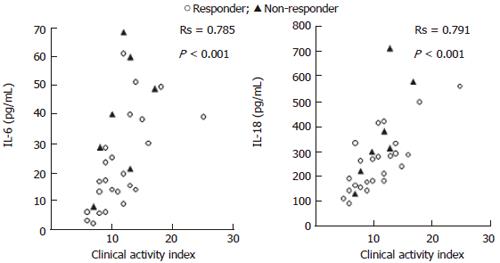
Figure 2 The relationship between blood levels of IL-6 and IL-18 and CAI in 31 patients with UC.
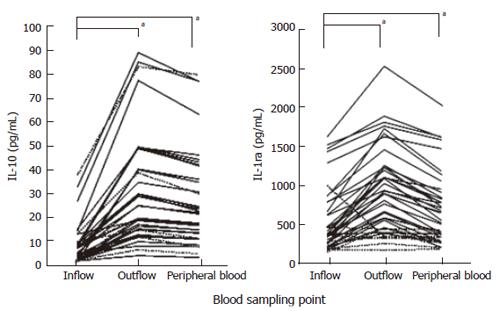
Figure 3 Blood levels of IL-10 and IL-1ra at the Adacolumn inflow (peripheral blood) at the start of GMA therapy and outflow at the end of the 60 min GMA and again peripheral blood just after the completion of 60 minutes GMA therapy in 31 patients with active UC.
aP < 0.05 vs inflow by Turkey-Kramer test.
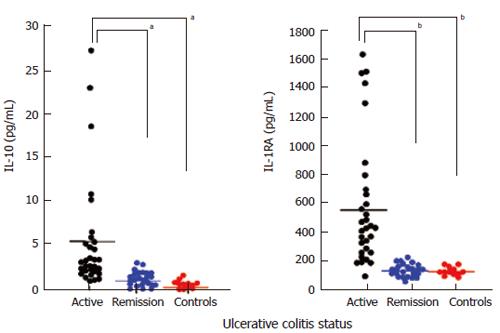
Figure 4 Blood levels of IL-10 and IL-1ra in patients with UC during active disease (n = 31), when in remission (n = 24) and in age matched controls (n = 12).
aP < 0.05, bP < 0.01 vs active by Scheffe’s test.
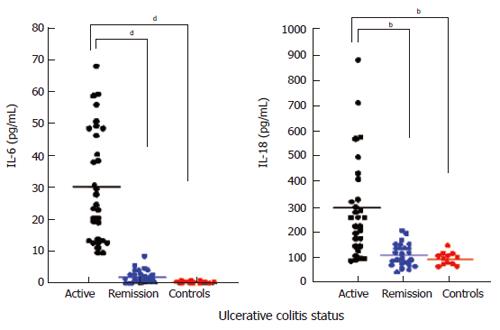
Figure 5 Blood levels of IL-6 and IL-18 (measured in serum samples) in patients with UC during active disease (n = 31), when in remission (n = 24) and in age matched controls (n = 12).
bP < 0.01, dP < 0.001 vs active by Scheffe’s test.
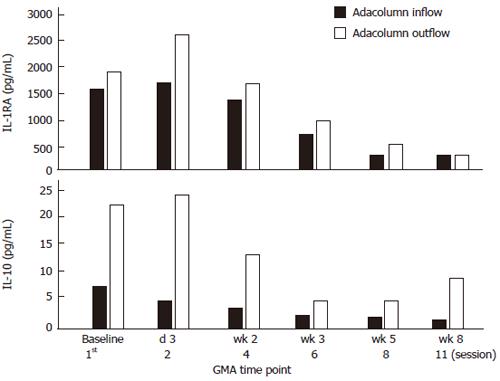
Figure 6 Changes in blood levels of IL-10 and IL-1ra in one typical case during an 8 wk GMA course (up to 11 GMA sessions).
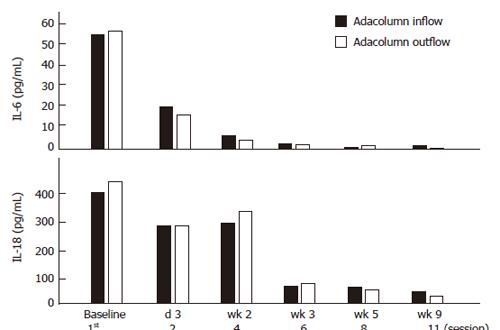
Figure 7 Similar to the data shown in Figure 6, here we see changes in blood levels of IL-6 and IL-18 were seen in one typical case during an 8 wk GMA course.
- Citation: Hanai H, Iida T, Yamada M, Sato Y, Takeuchi K, Tanaka T, Kondo K, Kikuyama M, Maruyama Y, Iwaoka Y, Nakamura A, Hirayama K, Saniabadi AR, Watanabe F. Effects of adacolumn selective leukocytapheresis on plasma cytokines during active disease in patients with active ulcerative colitis. World J Gastroenterol 2006; 12(21): 3393-3399
- URL: https://www.wjgnet.com/1007-9327/full/v12/i21/3393.htm
- DOI: https://dx.doi.org/10.3748/wjg.v12.i21.3393


