Copyright
©2006 Baishideng Publishing Group Co.
World J Gastroenterol. Apr 21, 2006; 12(15): 2455-2458
Published online Apr 21, 2006. doi: 10.3748/wjg.v12.i15.2455
Published online Apr 21, 2006. doi: 10.3748/wjg.v12.i15.2455
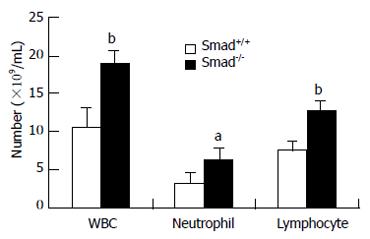
Figure 1 Total numbers and differential distributions of blood leukocytes in Smad3+/+ and Smad3-/- mice.
Peripheral blood samples were collected from tail veins of mice, and then analyzed on Sysmex F-820. Shown here are the means and standard deviations of total numbers and distributions of blood leukocytes from 4 wild-type and 4 mutant mice (aP < 0.05, bP < 0.01).
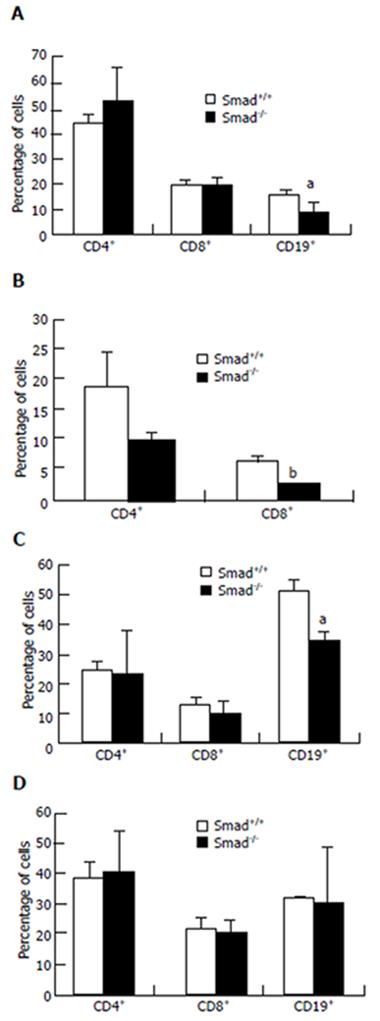
Figure 2 Percentage of lymphocyte subpopulations in peripheral blood (A), thymus (B), spleen (C) and lymph nodes (D) of wild-type and mutant mice.
The cells were stained with PE-anti-CD4 and FITC-anti-CD8, or with FITC-anti-CD3 and PE-anti-CD19, and then subjected to cytometric analyses. Shown here are the means and standard deviations of percentage of lymphocyte subpopulations from 4 wild-type and 4 mutant mice (aP < 0.05, bP < 0.01).
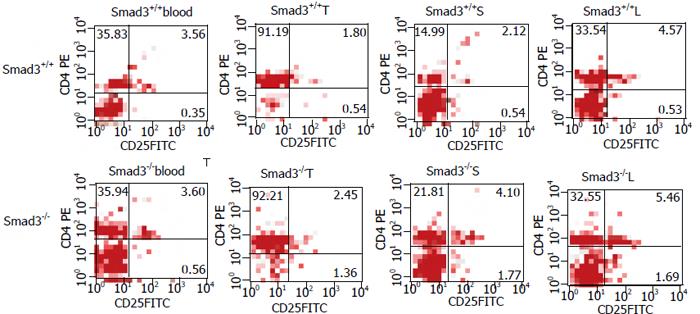
Figure 3 Percentage of CD4+CD25+ T cells in peripheral lymphoid tissues of Smad3+/+ and Smad3-/- mice.
PBMC (blood) or single-cell suspensions from thymus (T), spleen (S), and lymph nodes (L) were prepared according to “MATERIALS AND METHODS”, co-labeled with PE-anti-CD4 and FITC-anti-CD25, and then analyzed by FACScan.
- Citation: Wang ZB, Cui YF, Liu YQ, Jin W, Xu H, Jiang ZJ, Lu YX, Zhang Y, Liu XL, Dong B. Increase of CD4+CD25+ T cells in Smad3-/- mice. World J Gastroenterol 2006; 12(15): 2455-2458
- URL: https://www.wjgnet.com/1007-9327/full/v12/i15/2455.htm
- DOI: https://dx.doi.org/10.3748/wjg.v12.i15.2455


