Copyright
©2006 Baishideng Publishing Group Co.
World J Gastroenterol. Apr 7, 2006; 12(13): 2120-2124
Published online Apr 7, 2006. doi: 10.3748/wjg.v12.i13.2120
Published online Apr 7, 2006. doi: 10.3748/wjg.v12.i13.2120
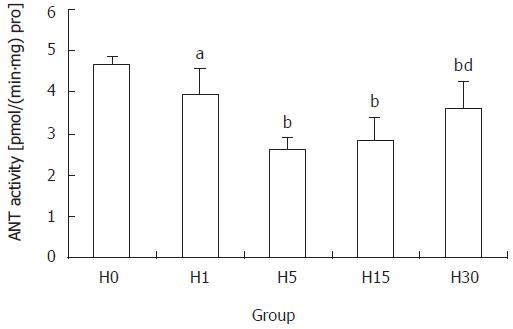
Figure 1 Change of mitochondrial ANT activity of rat liver during hypoxia exposure (mean±SD).
aP < 0.05, bP < 0.01 vs H0 group; dP < 0.01 vs H15 group.
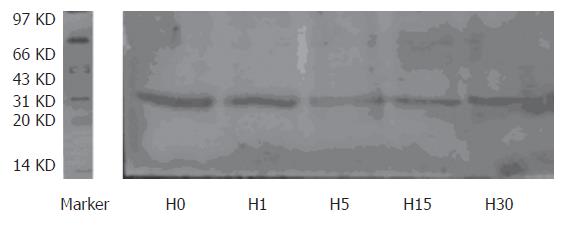
Figure 2 Western blot results of mitochondrial ANT protein in rat liver exposed to hypobaric hypoxia.
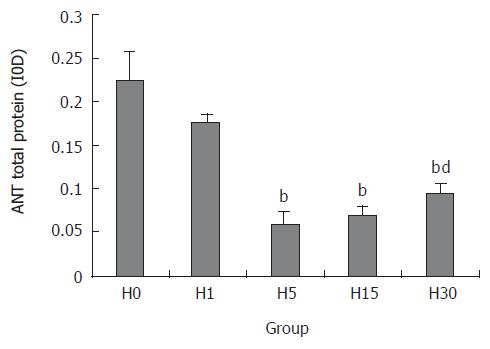
Figure 3 The effect of hypoxia on mitochondrial ANT total protein level (mean±SD).
bP < 0.01 vs H0 group; dP < 0.01 vs H15 group.
- Citation: Li CY, Liu JZ, Wu LP, Li B, Chen LF. Effects of hypobaric hypoxia on adenine nucleotide pools, adenine nucleotide transporter activity and protein expression in rat liver. World J Gastroenterol 2006; 12(13): 2120-2124
- URL: https://www.wjgnet.com/1007-9327/full/v12/i13/2120.htm
- DOI: https://dx.doi.org/10.3748/wjg.v12.i13.2120


