Copyright
©2005 Baishideng Publishing Group Inc.
World J Gastroenterol. Nov 28, 2005; 11(44): 6936-6940
Published online Nov 28, 2005. doi: 10.3748/wjg.v11.i44.6936
Published online Nov 28, 2005. doi: 10.3748/wjg.v11.i44.6936
Figure 1 HE staining of liver tissue 48 h (A) and 72 h (B) after MHV-3 infection in Balb/cJ mice and 72 h (C) after MHV-3 infection in A/J mice.
Arrows represent areas of hepatocyte necrosis.
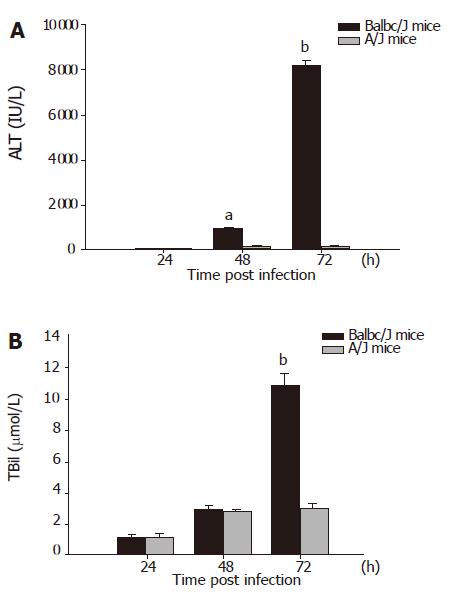
Figure 2 Serum ALT (A) and TBil (B) levels in MHV-3 infected Balb/cJ and A/J mice.
bP<0.01 vs A/J mice group.
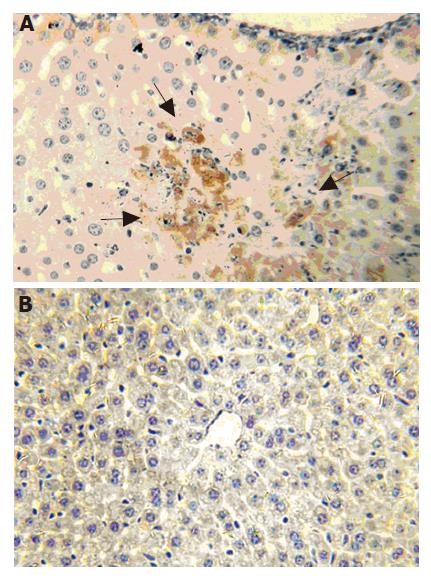
Figure 3 Mfgl2 expression in liver 24 h after MHV-3 infection Balb/cJ (A) and A/J (B) mice by immunohistochemical staining.
Arrows represent mfgl2 positive cells.
Figure 4 Immunohistochemical staining of hfgl2 in liver of patients with server AOC hepatitis B (A) and mild chronic hepatitis B (B) or in PBMC of patients with severe AOC hepatitis B (C).
Arrows represent hfgl2 positive cells.
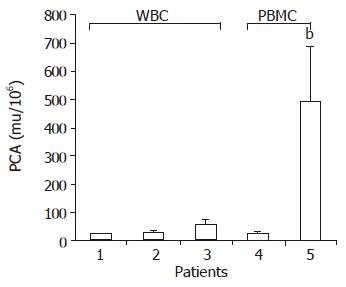
Figure 5 PCA levels in PBMC and WBC of patients.
1. Healthy control; 2. patients with mild chronic hepatitis B; 3. patients with severe AOC hepatitis B; 4. healthy control; 5. patients with severe AOC hepatitis B. bP<0.01 vs group 4
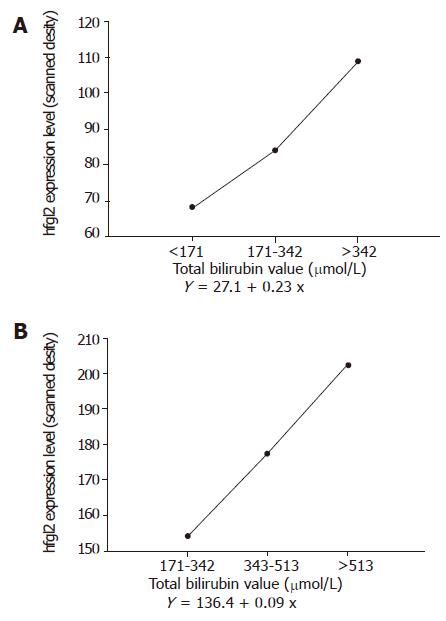
Figure 6 Correlation of hfgl2 expression in liver (A) and PBMC (B) with serum TBil level.
- Citation: Zhu CL, Yan WM, Zhu F, Zhu YF, Xi D, Tian DY, Levy G, Luo XP, Ning Q. Fibrinogen-like protein 2 fibroleukin expression and its correlation with disease progression in murine hepatitis virus type 3-induced fulminant hepatitis and in patients with severe viral hepatitis B. World J Gastroenterol 2005; 11(44): 6936-6940
- URL: https://www.wjgnet.com/1007-9327/full/v11/i44/6936.htm
- DOI: https://dx.doi.org/10.3748/wjg.v11.i44.6936


